Jun-2026
Sales
Trend
6-Month
Product Count
SKUs
Avg Price
YoY Sales Change
YoY Price Change
Market Insights Snapshot
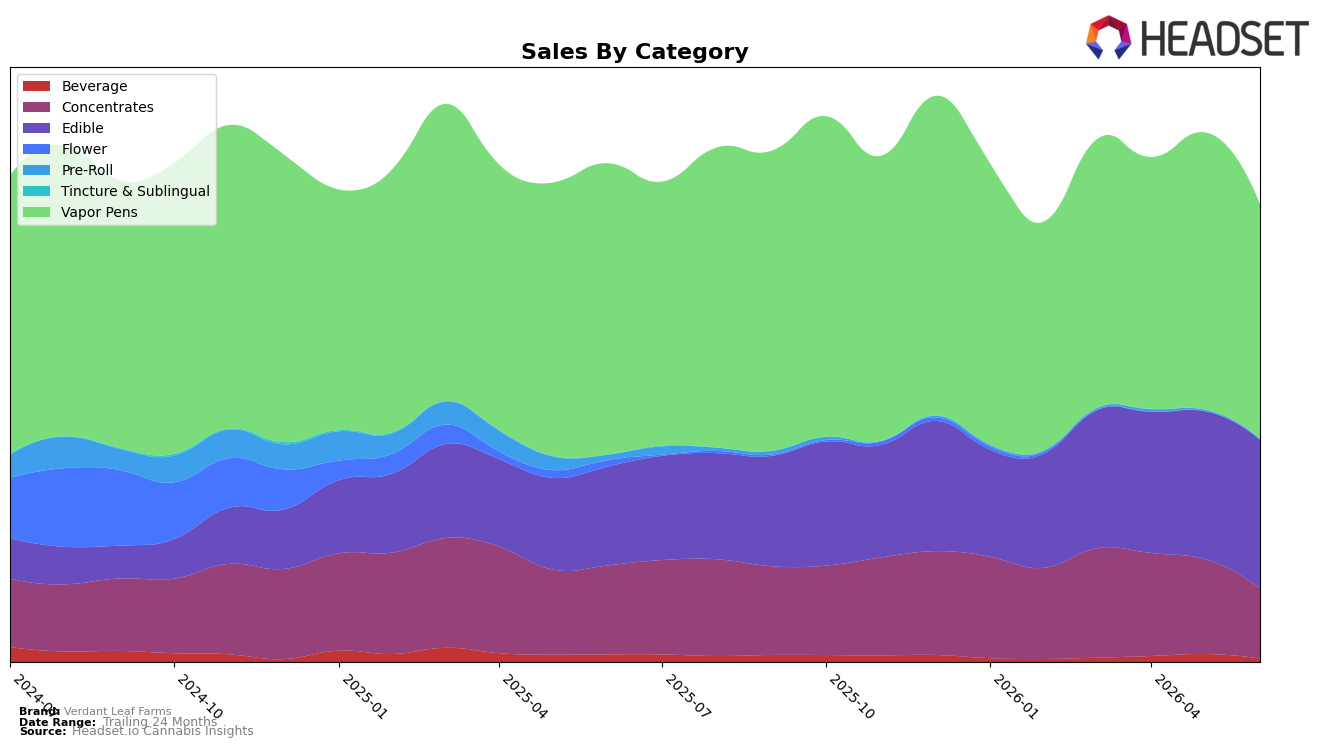
In June 2026, Verdant Leaf Farms pivoted toward Edible, lifting its category share to 32.44% while Vapor Pens fell to 51.33% share, a mix shift shaped by a 50.06% year-over-year sales increase and 0.23% month-over-month uptick in Edible against Vapor Pens declines of 19.46% YoY and 15.36% MoM. Concentrates contracted to 15.34% share with sales down 21.05% YoY and 26.05% MoM, and long-tail formats retreated as Beverage dropped 54.84% YoY and 56.62% MoM and Pre-Roll fell 86.95% YoY and 29.52% MoM; combined with an 10.94% YoY average price reduction, this mix implies the brand traded volume into lower-priced formats to offset weakness in inhalables. The thesis is that the Edible surge partially backfilled declining inhalable demand but could compress revenue efficiency given Vapor Pens carry higher average prices than Edible in June 2026.
Positioning-wise, anchoring half the revenue in Vapor Pens while ranking 17th in Oregon Vapor Pens creates exposure to a shrinking pillar, as the 19.46% YoY and 15.36% MoM declines outpace total-brand sales change of -8.18% YoY and 24-month drift of -4.76%. The 50.06% YoY Edible growth with only 0.23% MoM momentum suggests acquisition rather than repeat velocity, while Concentrates’ 21.05% YoY and 26.05% MoM drops limit cross-sell into higher-potency tiers; with average price at $10.83 and Vapor Pens at $17.91 versus Edible at $5.88, the current trajectory tilts the portfolio toward lower-ticket baskets. The thesis is that Verdant Leaf Farms must either restore Vapor Pen velocity at rank 17 or shift mix further into Edible with margin safeguards, because the present blend raises unit throughput but risks sustained revenue dilution per transaction in July 2026 and beyond.
Competitive Landscape
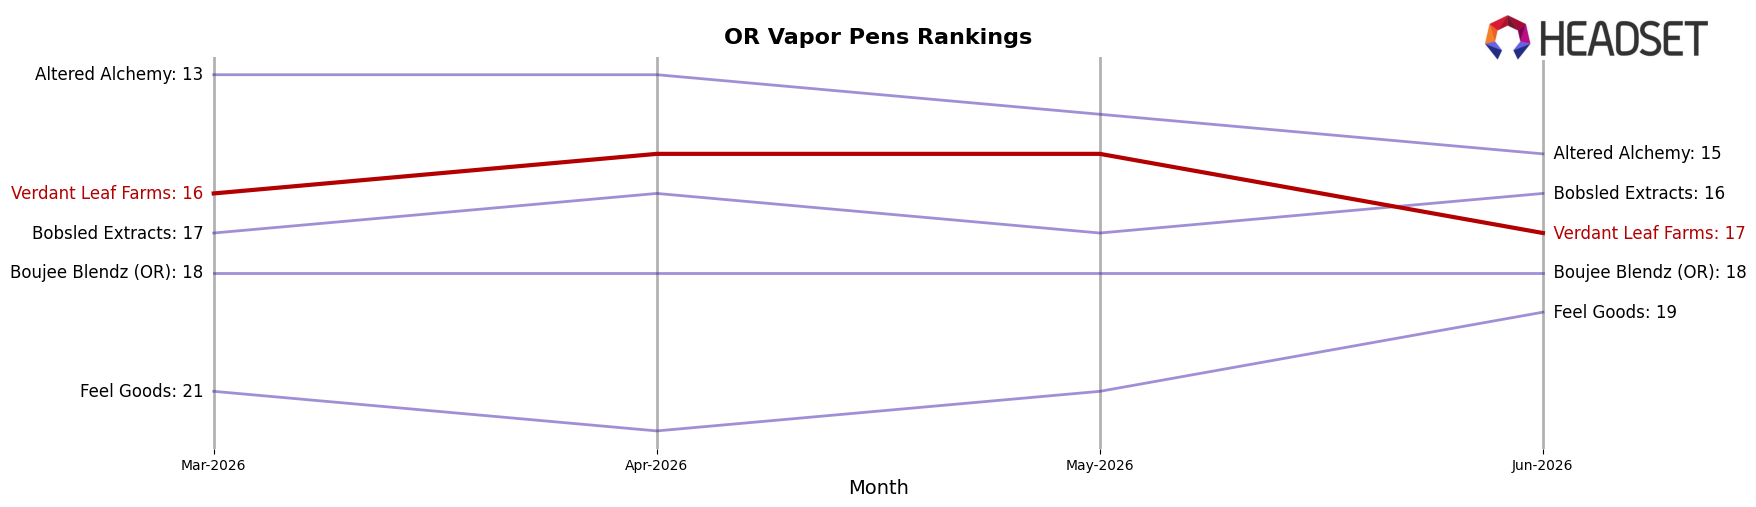
Verdant Leaf Farms sits at rank #17 in OR Vapor Pens in June 2026, down 2 positions year over year from #15 and down 1 position from March 2026’s #16, while also trailing its December 2025 peak of #13 by 4 spots; in contrast, Buddies moved up from #2 to #1 with a 16.9% YoY sales increase and FRESHY climbed from #5 to #2 alongside an 81.5% YoY gain. The mix of Verdant Leaf Farms’ mild rank slippage against Oregrown jumping from #11 to #5 and Hellavated edging from #3 to #4 implies that share is consolidating toward brands improving rank or sustaining top-5 positions, so Verdant Leaf Farms’ recent drift from #16 to #17 signals a need to counter accelerating competitor momentum to avoid a continued slide away from the top-15.
Notable Products
Grape Rosin Gummy (100mg) posted the steepest decline in June 2026 with a -11.9% month-over-month drop while sliding to rank 7, as Pink Lemonade x Government Oasis Live Rosin Nanotech Gummy (100mg) eased -4.1% at rank 1. Cherry Live Rosin Gummy (100mg) moved up 16.0% month over month to hold rank 2, creating a widening spread between the top two SKUs and the rest of the edible set. Seven of the top ten SKUs are Edible products, concentrating demand in confections while Vapor Pens occupy only ranks 3 and 9 despite Deep Fried Haze Live Rosin & Cured Resin Cartridge (1g) generating $40,975 at rank 3. The pattern implies Verdant Leaf Farms is leaning into a gummy-led lineup where flavor variety sustains share, but a single underperforming SKU can drag average velocity, pointing to selective pruning rather than broad category shifts.
Top Selling Cannabis Brands
Data for this report comes from real-time sales reporting by participating cannabis retailers via their point-of-sale systems, which are linked up with Headset’s business intelligence software. Headset’s data is very reliable, as it comes digitally direct from our partner retailers. However, the potential does exist for misreporting in the instance of duplicates, incorrectly classified products, inaccurate entry of products into point-of-sale systems, or even simple human error at the point of purchase. Thus, there is a slight margin of error to consider. Brands listed on this page are ranked in the top twenty within the market and product category by total retail sales volume.

