.svg)

Sep-2026
Sales
Trend
6-Month
Product Count
SKUs
Avg Price
YoY Sales Change
YoY Price Change


Where to Buy
Buckeye Relief is stocked at 99 licensed dispensaries across Ohio, with the deepest coverage in Columbus, Cincinnati, Cleveland, Dayton, and Akron. Search by ZIP code or city below to find the closest one, or filter by product type if you are after a specific format.
Market Insights Snapshot
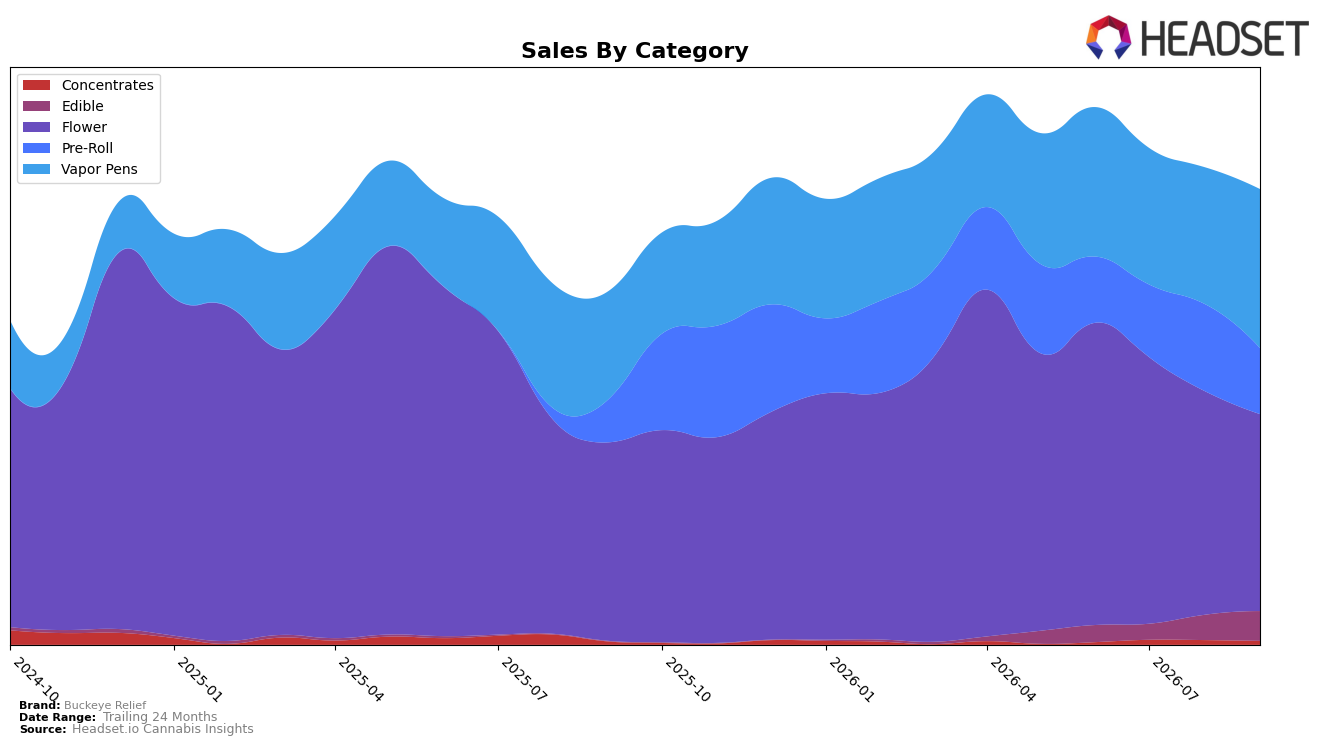
Buckeye Relief’s category mix in September 2026 leaned on Flower at 43.30% share with a -0.76% year-over-year change and a -11.99% month-over-month dip, while Vapor Pens climbed to 34.94% share with +46.98% YoY and +16.27% MoM, indicating a pivot in volume toward inhalables. Pre-Roll held 14.48% share with +54.65% YoY but -24.22% MoM, and Edible expanded to 6.48% share with +12,166.89% YoY and +18.07% MoM, alongside Concentrates at 0.80% share with +19.36% YoY and -17.68% MoM; with Buckeye Relief ranked 11th in Flower in Ohio, the simultaneous MoM contraction in Flower and Pre-Roll against MoM growth in Vapor Pens and Edible implies near-term substitution toward non-flower formats.
The mix shift—Flower’s -11.99% MoM alongside Vapor Pens’ +16.27% MoM and Edible’s +18.07% MoM, combined with Pre-Roll’s -24.22% MoM—suggests Buckeye Relief is migrating basket trips from value-per-gram segments into higher-repeat, format-flexible items, reinforced by a -10.95% YoY average price move that can widen Vapor Pens and Edible trial. Given a 43.30% Flower share versus a 34.94% Vapor Pens share and an 11th rank in Ohio Flower, the pattern implies the brand’s positioning is shifting from Flower-led to mixed-format, where incremental share gains are more likely to accrue in Vapor Pens and Edible than in Flower over the next few cycles.
Competitive Landscape
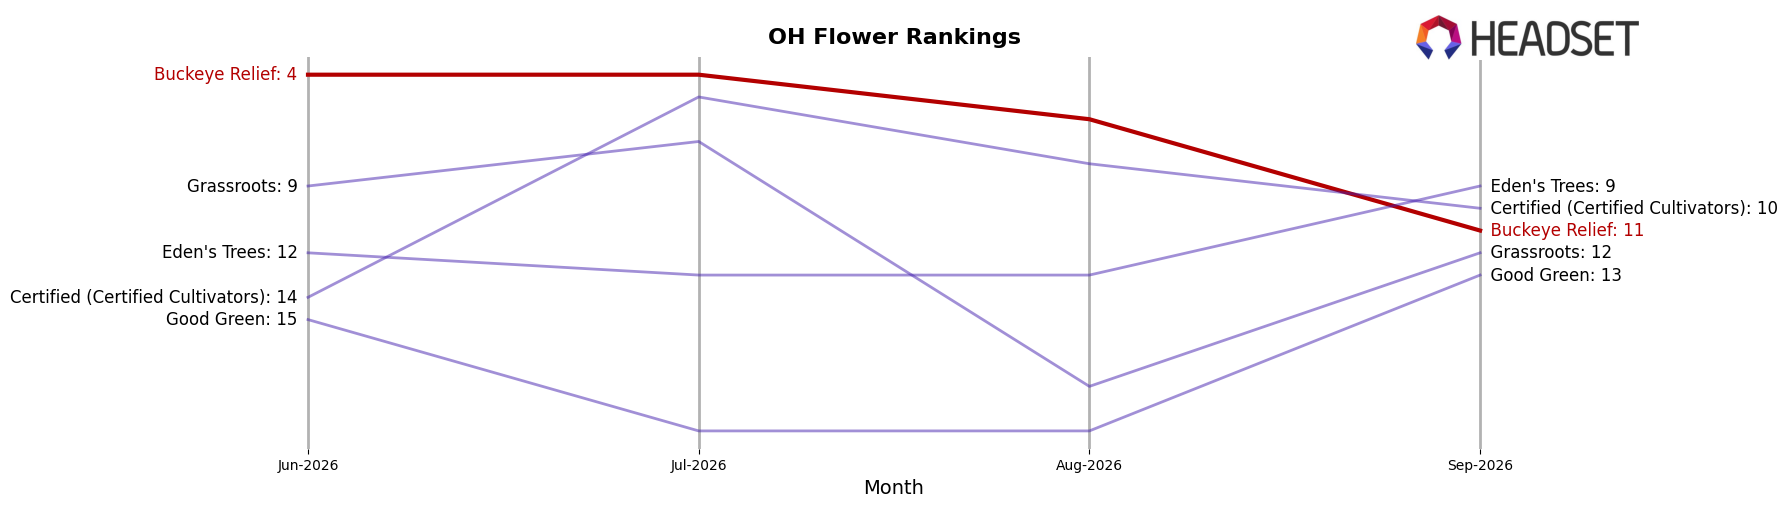
Buckeye Relief sits at rank #11 in OH Flower in September 2026, sliding 2 positions year over year from #9 while falling 7 spots from #4 in June 2026; the brand also peaked at #1 in April 2026, indicating a sharp descent from that high-water mark. Competitive pressure intensified as Klutch Cannabis holds #1 after climbing 12 places from #13 with 162.4% year-over-year sales growth, and King City Gardens is #2 after rising 8 places from #10 alongside 77.4% growth, while Riviera Creek maintains #3 despite a 1.7% sales contraction; in contrast, Buckeye Relief’s rank erosion from #1 in April 2026 to #11 in September 2026, alongside competitors’ double- and triple-digit growth, implies a share redistribution away from Buckeye Relief that requires either assortment reset or pricing moves to halt continued downranking.
Notable Products
Garlic Breath 2.0 Pre-Roll (1g) posted the standout move in September 2026 with an 88.3% month-over-month surge to rank 1, while Moon Walker - GMO x Blueberry Live Resin Infused Pre-Roll 5-Pack (2.5g) fell 35.8% to rank 10. Edibles compressed as Grape Gummy Bar 10-Pack (100mg) declined 14.0% at rank 4 and Orange Gummy Bar 10-Pack (100mg) slipped 7.0% at rank 3, while Cherry Gummy Bar 10-Pack (100mg) was roughly flat at -1.0% despite holding rank 2. With three Pre-Roll SKUs in the top ten and a single SKU driving the largest gain, the mix implies Buckeye Relief is pivoting toward inhalables where spikes can quickly re-order the leaderboard.
Top Selling Cannabis Brands






Data for this report comes from real-time sales reporting by participating cannabis retailers via their point-of-sale systems, which are linked up with Headset’s business intelligence software. Headset’s data is very reliable, as it comes digitally direct from our partner retailers. However, the potential does exist for misreporting in the instance of duplicates, incorrectly classified products, inaccurate entry of products into point-of-sale systems, or even simple human error at the point of purchase. Thus, there is a slight margin of error to consider. Brands listed on this page are ranked in the top twenty within the market and product category by total retail sales volume.

