Jun-2026
Sales
Trend
6-Month
Product Count
SKUs
Avg Price
YoY Sales Change
YoY Price Change
Market Insights Snapshot
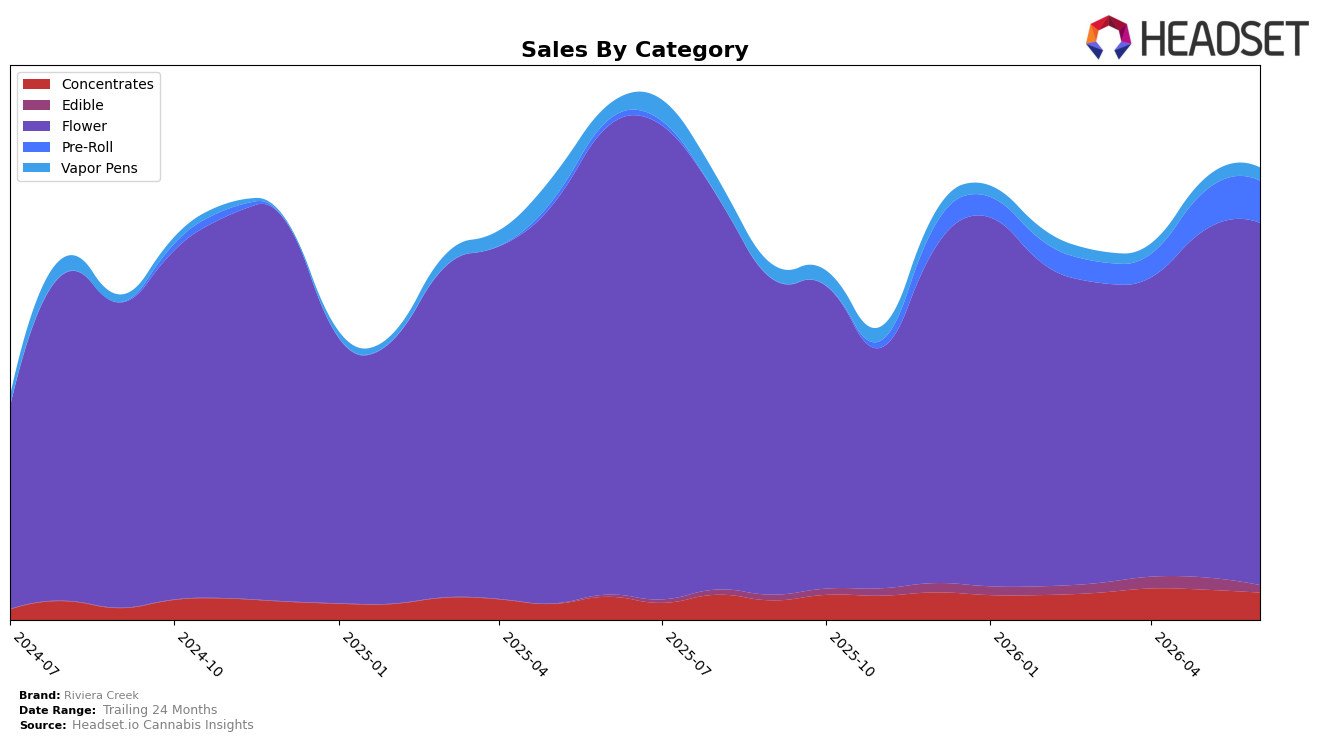
Riviera Creek’s mix in June 2026 is concentrated in Flower at 80.27% share with year-over-year sales down 22.73% but month-over-month up 4.29%, while Pre-Roll climbed to 9.26% share with 663.66% year-over-year growth and 8.96% month-over-month growth. Concentrates holds 6.06% share with 18.19% year-over-year growth but a 9.71% month-over-month decline, and Vapor Pens at 2.84% share is down 13.71% year-over-year yet up 4.37% month-over-month; Edible sits at 1.57% share with 310.41% year-over-year growth but a 39.96% month-over-month drop. With overall brand sales down 12.19% year-over-year and average price down 20.33%, the pattern implies a deliberate pivot toward lower-priced formats and pack sizes to offset Flower contraction while stabilizing volume through Pre-Roll expansion.
The category shifts position Riviera Creek to lean on high-velocity Pre-Roll and steady Concentrates to buffer a Flower-heavy base, sustaining scale in Ohio while guarding its Flower ranking at position 2. The 4.29% month-over-month lift in Flower alongside an 8.96% month-over-month rise in Pre-Roll suggests near-term shelf momentum, but the 39.96% month-over-month decline in Edible and the 9.71% month-over-month pullback in Concentrates indicate selective pruning; together with a 20.33% average price reduction, this implies a pricing-led defense aimed at preserving share in Flower and trading consumers into value tiers where Pre-Roll growth can compound.
Competitive Landscape
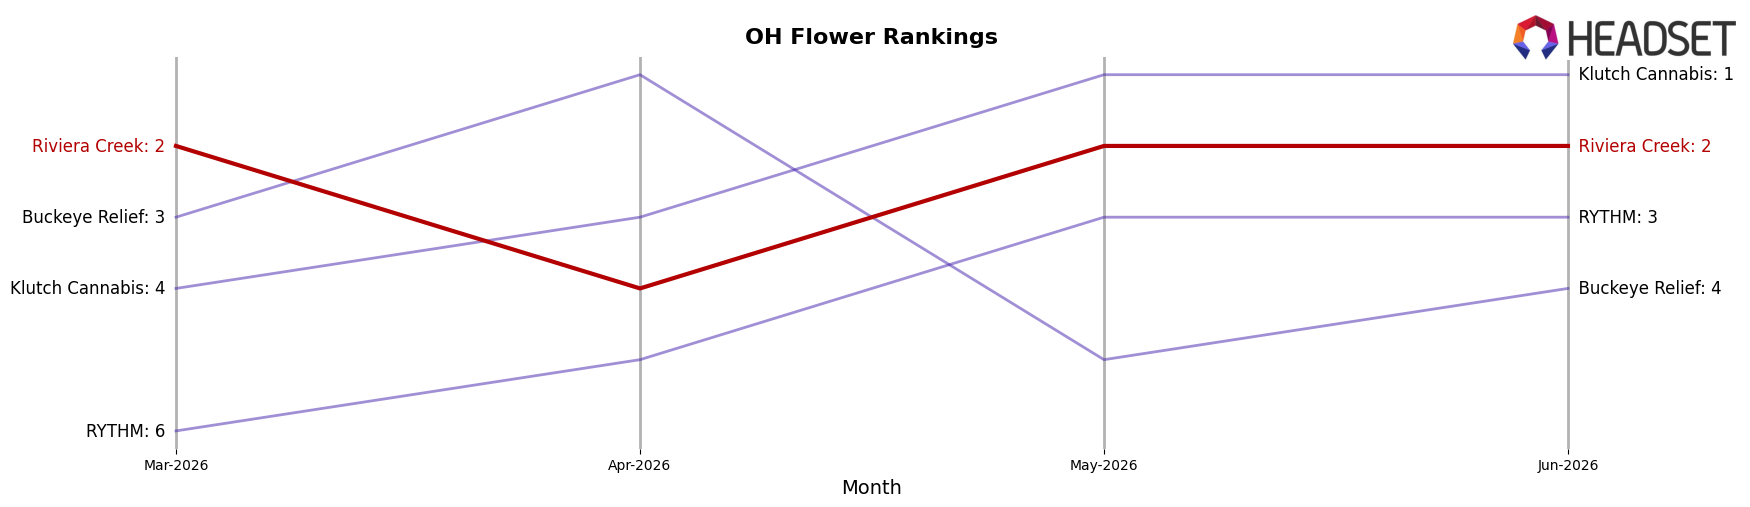
Riviera Creek sits at rank #2 in OH Flower in June 2026, down 1 position year over year yet steady versus March 2026 at #2, while its peak at #1 in January 2026 contrasts with the current slot; meanwhile, Klutch Cannabis climbed from #20 to #1 year over year with 304.8% sales growth, and RYTHM moved from #9 to #3 with 67.7% growth, indicating upward pressure from faster risers than Riviera Creek. In parallel, Buckeye Relief slipped from #2 to #4 with a 19.5% sales decline while Farkas Farms / Bullseye Gardens advanced from #12 to #5 with 29.4% growth, suggesting the tier below is consolidating and compressing the gap to the #2 position; the pattern implies Riviera Creek’s rank trajectory is stabilizing below its January 2026 peak as faster-growing competitors redefine the top tier.
Notable Products
Yo Rocks (3.5g) posted the steepest decline in June 2026 at -20.2% and slid to rank 2, while Riviera Creek Moon Rocks (1g) fell -12.5% at rank 4, signaling pressure on legacy Flower. Stambaugh GC (3.5g) rose 5.4% to hold rank 1 as Garlic Cookies (3.5g) dropped -17.5% at rank 6, and four of the top ten are Flower SKUs concentrated in just two families, indicating category dependence with uneven momentum. Yo Rocks Smalls (7g) contracted -17.0% at rank 8 as Moon Rocks Wax (1g) softened -8.8% at rank 10, with Space Rock Wax (1g) near-flat at -3.7% and rank 3 against the $311,369 anchor from Stambaugh GC (3.5g). The pattern implies Riviera Creek is leaning on a single flagship while broader Flower variants cool, pushing assortment strategy toward reinforcing the leader and rebalancing into resilient Concentrates to stabilize share.
Top Selling Cannabis Brands
Data for this report comes from real-time sales reporting by participating cannabis retailers via their point-of-sale systems, which are linked up with Headset’s business intelligence software. Headset’s data is very reliable, as it comes digitally direct from our partner retailers. However, the potential does exist for misreporting in the instance of duplicates, incorrectly classified products, inaccurate entry of products into point-of-sale systems, or even simple human error at the point of purchase. Thus, there is a slight margin of error to consider. Brands listed on this page are ranked in the top twenty within the market and product category by total retail sales volume.

