Jun-2026
Sales
Trend
6-Month
Product Count
SKUs
Avg Price
YoY Sales Change
YoY Price Change
Market Insights Snapshot
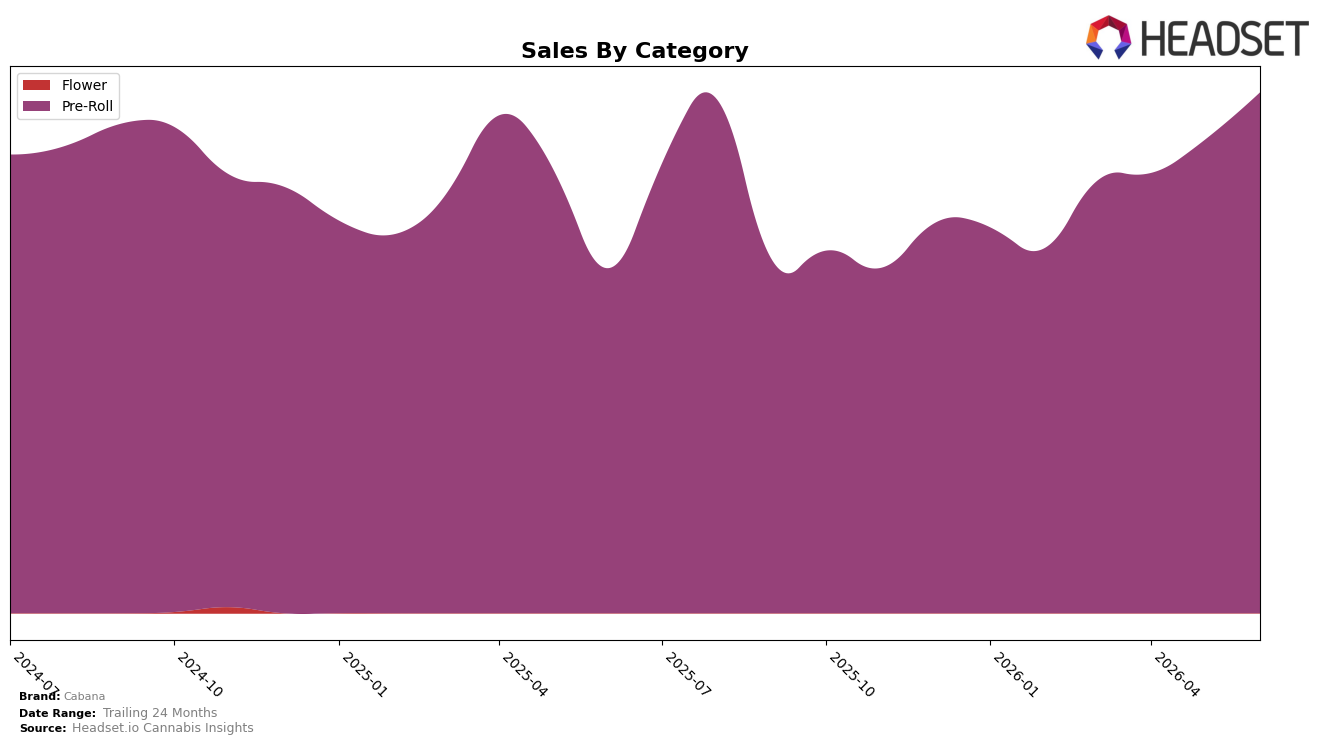
Cabana's category mix in June 2026 is fully concentrated in Pre-Roll at 100.0% share, with the segment up 51.0% year over year and 10.1% month over month; the average item price declined 2.2% YoY while unit-driven gains lifted total sales. Within Oregon Pre-Rolls, Cabana sits at rank 11, indicating upward momentum despite a price dip and aligning with the brand’s 51.0% YoY sales growth and 10.1% MoM expansion; the pattern implies Cabana is trading elasticity for volume in a single-category strategy that is currently paying off.
The consolidation in Pre-Roll paired with a 2.2% YoY price decrease and a rank of 11 in Oregon suggests a deliberate value-led position aimed at capturing incremental trips and multi-pack baskets rather than premium trade-up. With 51.0% YoY growth against a 10.1% MoM lift, the near-term cadence is slower than the annual pace, implying the brand may be nearing a volume plateau at current price points; sustaining rank advancement from 11 may require either mix expansion beyond Pre-Roll or targeted price/mix optimization within Pre-Roll to unlock further share without eroding margin.
Competitive Landscape
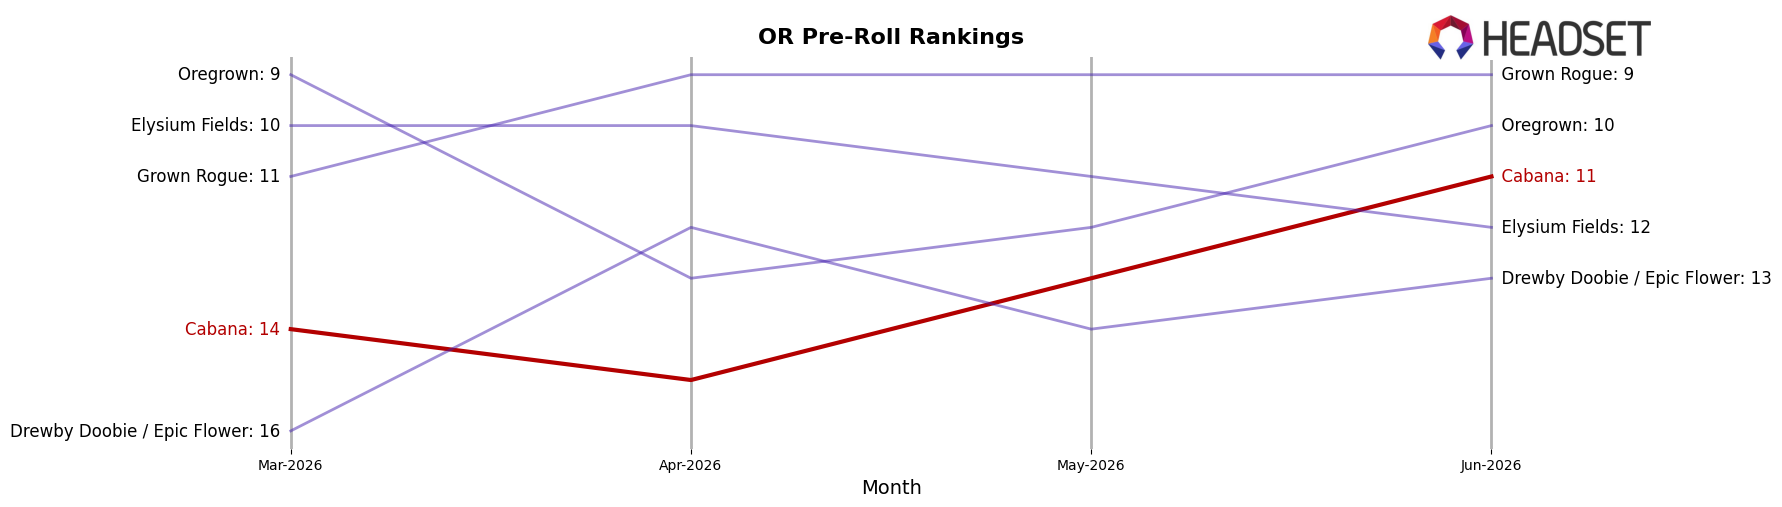
Cabana sits at rank #11 in Oregon Pre-Roll for June 2026, improving 8 positions year over year from #19, and edging up 3 spots from March 2026 when it was #14; however, it remains just outside its peak position of #10 last reached in September 2024, indicating recovery but not yet surpassing its prior high. Competitive movement is tightening at the top: STiCKS climbed from #2 to #1 with 164.98% year-over-year sales growth, while Kaprikorn rose from #5 to #2 on 113.36% growth, whereas Portland Heights slipped from #3 to #4 with a 26.34% decline; this mix of triple-digit advances and double-digit declines implies Cabana’s upward rank trajectory is driven by relative stability amid volatility, but to move from #11 back into the top 10 and beyond, it must convert incremental gains into share capture against faster-rising leaders.
Notable Products
Blue Dream Pre-Roll (1g) posted the standout move in June 2026 with an 84.6% month-over-month increase, jumping into rank 2 while Rainbow Marker Pre-Roll (1g) fell 40.9% to rank 3. Sour Candy Lope Pre-Roll (1g) held rank 1 with $31,558, and Cheesy Poofs Pre-Roll (1g) rose 47.4% at rank 6, indicating momentum is concentrated in select SKUs while others retrench. With all ten top products in June 2026 coming from the Pre-Roll category, the mix points to a deepening focus on single-format dominance where a few high-velocity strains pull share and guide portfolio decisions.
Top Selling Cannabis Brands
Data for this report comes from real-time sales reporting by participating cannabis retailers via their point-of-sale systems, which are linked up with Headset’s business intelligence software. Headset’s data is very reliable, as it comes digitally direct from our partner retailers. However, the potential does exist for misreporting in the instance of duplicates, incorrectly classified products, inaccurate entry of products into point-of-sale systems, or even simple human error at the point of purchase. Thus, there is a slight margin of error to consider. Brands listed on this page are ranked in the top twenty within the market and product category by total retail sales volume.

