.svg)
Sep-2026
Sales
Trend
6-Month
Product Count
SKUs
Avg Price
YoY Sales Change
YoY Price Change


Where to Buy
Benson Arbor is stocked at 162 licensed dispensaries across Oregon, with the deepest coverage in Portland, Eugene, Bend, Medford, and Corvallis. Search by ZIP code or city below to find the closest one, or filter by product type if you are after a specific format.
Market Insights Snapshot
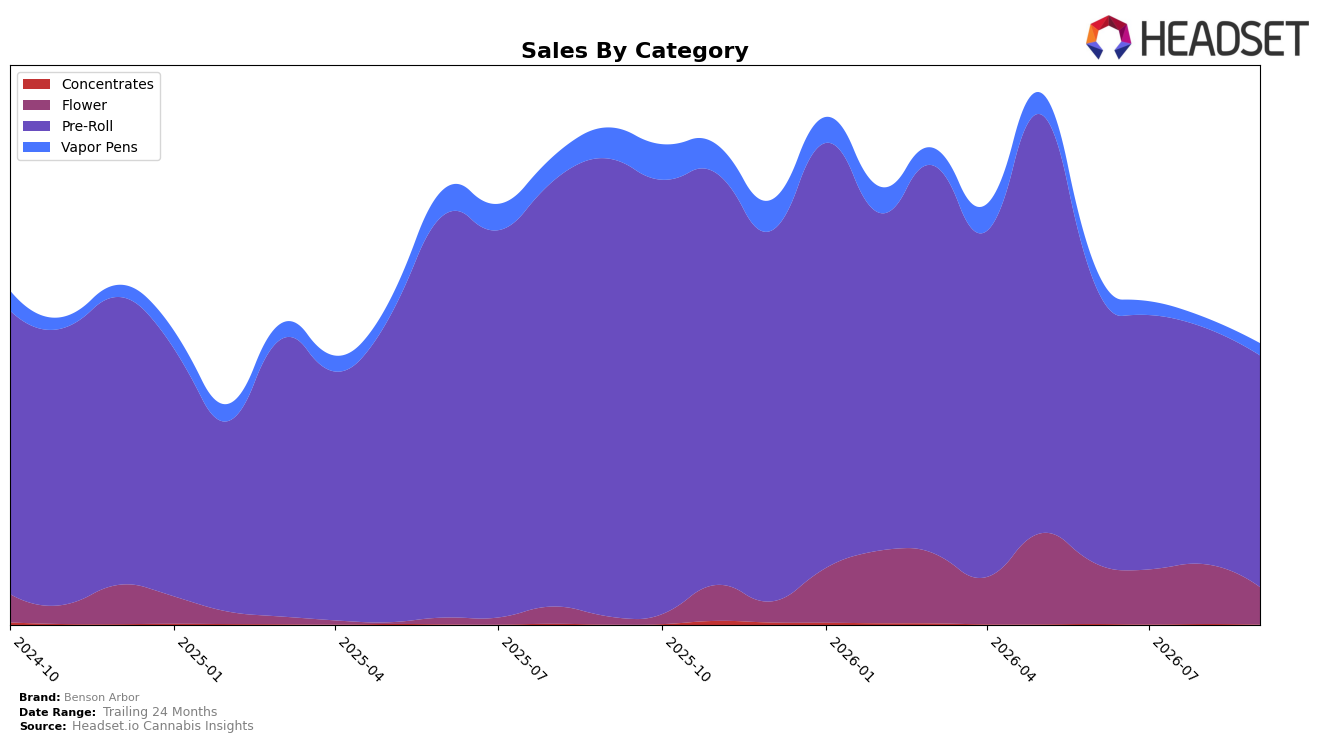
In September 2026, Benson Arbor concentrated 82.55% of sales in Pre-Roll while holding rank 7 in Oregon Pre-Roll, with category sales down 49.44% year over year and 2.05% month over month; this concentration coincided with a 23.01% year-over-year drop in average price to $8.52 and a brand-wide sales decline of 43.50% year over year. Flower expanded to 13.23% share on a 377.85% year-over-year lift but contracted 37.59% month over month, while Vapor Pens held 4.22% share with sales down 61.46% year over year yet up 19.16% month over month; the mix indicates reliance on Pre-Roll volume in Oregon despite divergent momentum across secondary categories.
The divergence—Pre-Roll’s 2.05% month-over-month dip alongside Vapor Pens’ 19.16% month-over-month rise and Flower’s 37.59% month-over-month pullback—implies Benson Arbor is overexposed to a softening core while price compression of 23.01% year over year narrows room to trade up. With Pre-Roll anchoring 82.55% share yet ranking only 7th in-state, the path forward points to reallocating toward formats showing short-cycle traction (e.g., Vapor Pens) and using Flower’s 377.85% year-over-year expansion to diversify mix resilience, because the current configuration amplified the 43.50% year-over-year brand sales decline rather than offsetting it.
Competitive Landscape
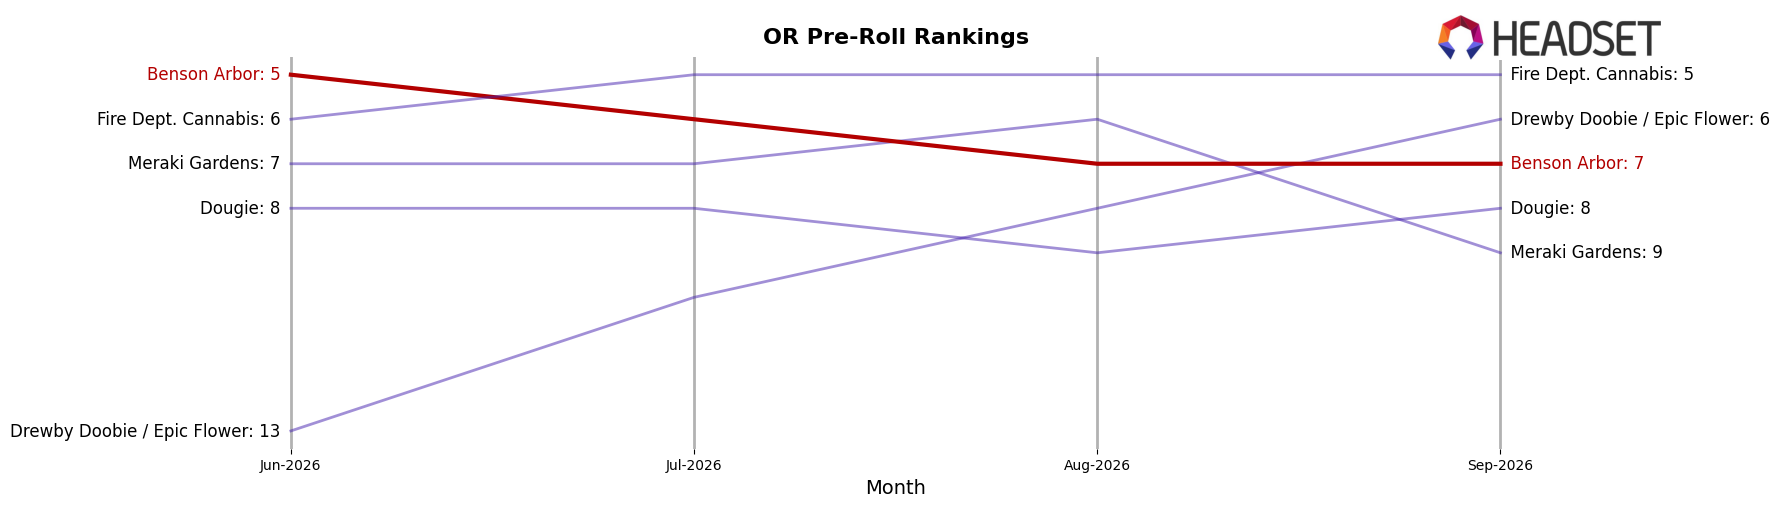
Benson Arbor sits at rank #7 in OR Pre-Roll in September 2026 after a year-over-year slide of 4 positions from #3, and it has fallen 2 spots since June 2026 when it was #5; the brand’s current #7 also trails its January 2026 peak of #2 by 5 positions. Competitive pressure is reshaping the top end: STiCKS holds #1 with a year-over-year hold at #1 and 91.7% sales growth, while Kaprikorn climbed from #6 to #2 with 160.0% sales growth, and Hellavated slid from #2 to #3 alongside a 27.1% sales decline. With Benson Arbor dropping from #5 to #7 over the last three months and from #3 to #7 year over year, the trajectory implies share is being redistributed toward faster-rising leaders and that Benson Arbor must counter momentum at the top to avoid further rank erosion.
Notable Products
Chem Fuego #15 Pre-Roll (1g) posted the steepest movement in September 2026 with a -38.1% month-over-month decline while sitting at rank 7, and Anirado x Gas Face Pre-Roll 10-Pack (5g) also slid -20.9% at rank 4, implying a pullback concentrated in select SKUs despite their prior top-10 presence. In contrast, Jet Fighter x Tropic Lemons #9 Pre-Roll 10-Pack (5g) rose +11.4% month over month at rank 2 alongside Road Daawg x Anirado Pre-Roll 10-Pack (5g) at rank 2 with +0.7%, signaling that multipack formats are holding share even as single-stick Pre-Roll placements at ranks 6 and 7 soften. With four of the top ten in multipack Pre-Roll formats and only one raw-dollar leader clearing $16,932, the mix points to Benson Arbor leaning into higher-frequency 10-pack demand while reducing reliance on volatile single-gram SKUs.
Top Selling Cannabis Brands






Data for this report comes from real-time sales reporting by participating cannabis retailers via their point-of-sale systems, which are linked up with Headset’s business intelligence software. Headset’s data is very reliable, as it comes digitally direct from our partner retailers. However, the potential does exist for misreporting in the instance of duplicates, incorrectly classified products, inaccurate entry of products into point-of-sale systems, or even simple human error at the point of purchase. Thus, there is a slight margin of error to consider. Brands listed on this page are ranked in the top twenty within the market and product category by total retail sales volume.

