.svg)

Sep-2026
Sales
Trend
6-Month
Product Count
SKUs
Avg Price
YoY Sales Change
YoY Price Change


Where to Buy
Cali-Blaze is stocked at 795 licensed dispensaries across Michigan, Massachusetts, and Colorado, 481 of them in Michigan, with the deepest coverage in Detroit, New Buffalo, Monroe, Grand Rapids, and Flint. Search by ZIP code or city below to find the closest one, or filter by product type if you are after a specific format.
Market Insights Snapshot
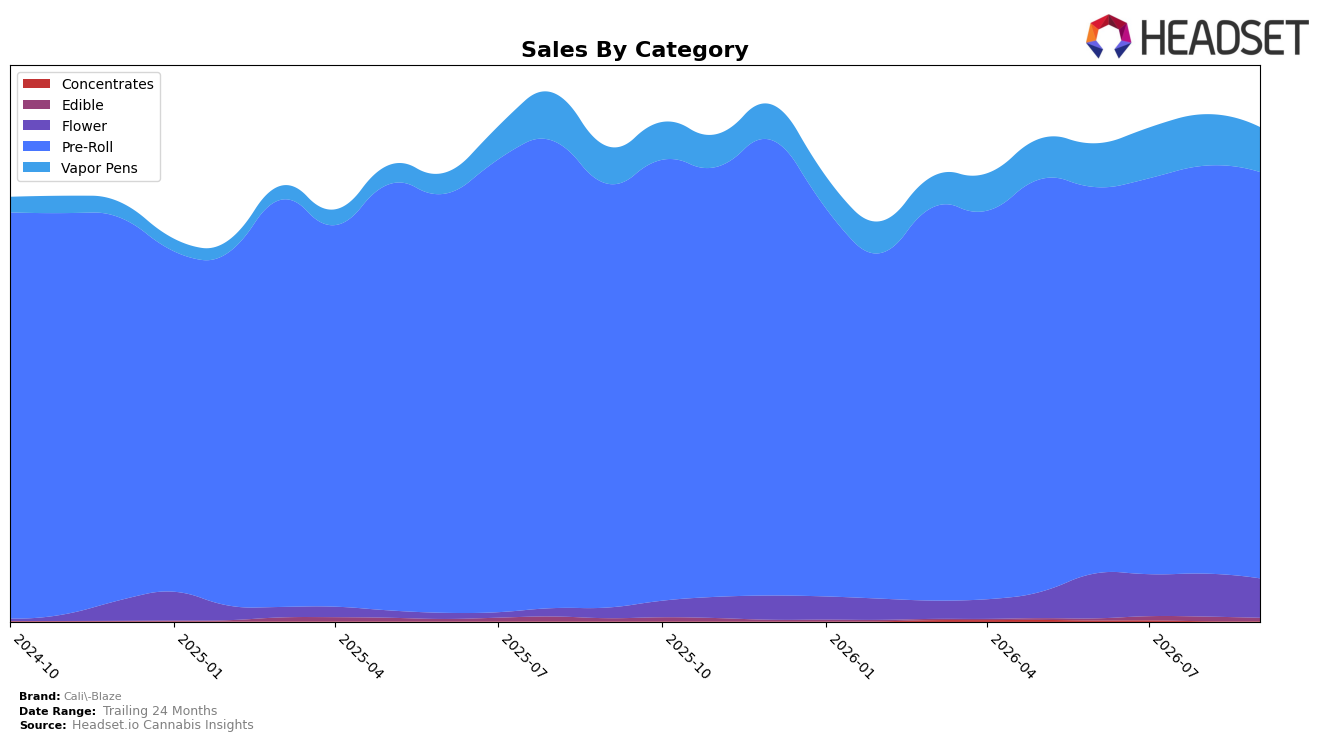
In September 2026, Cali-Blaze remained heavily concentrated in Pre-Roll at 82.40% share, even as Pre-Roll declined -4.09% year over year and -0.39% month over month. Vapor Pens held 9.04% share with +20.69% YoY growth but slipped -12.76% MoM, while Flower reached 7.91% share with a +280.07% YoY surge despite an -8.29% MoM pullback. Edible represented 0.62% share with +10.15% YoY and -26.79% MoM, and Concentrates were 0.03% share with a -40.16% MoM drop. The pattern implies Cali-Blaze traded into higher-price segments (average price up 27.31% YoY to $9.03) without broad-based monthly momentum, leaving category breadth improved but near-term mix pressure dominated by Pre-Roll softness.
Cali-Blaze’s category tilt suggests a positioning anchored in value-led Pre-Roll scale while selectively laddering into higher-ticket formats where unit volatility is higher and timing-sensitive. The +280.07% YoY in Flower alongside -8.29% MoM and the +20.69% YoY in Vapor Pens alongside -12.76% MoM indicate portfolio expansion that lifts annual reach but introduces monthly demand swings; paired with Pre-Roll’s -4.09% YoY and -0.39% MoM, the brand’s mix implies a strategy of defending share leadership in Colorado Pre-Roll at rank 1 while using Flower and Vapor Pens to stretch price laddering. The implication is that sustaining rank 1 requires stabilizing monthly sell-through in the newer categories to buffer Pre-Roll downticks and to convert YoY gains into steadier MoM contribution.
Competitive Landscape
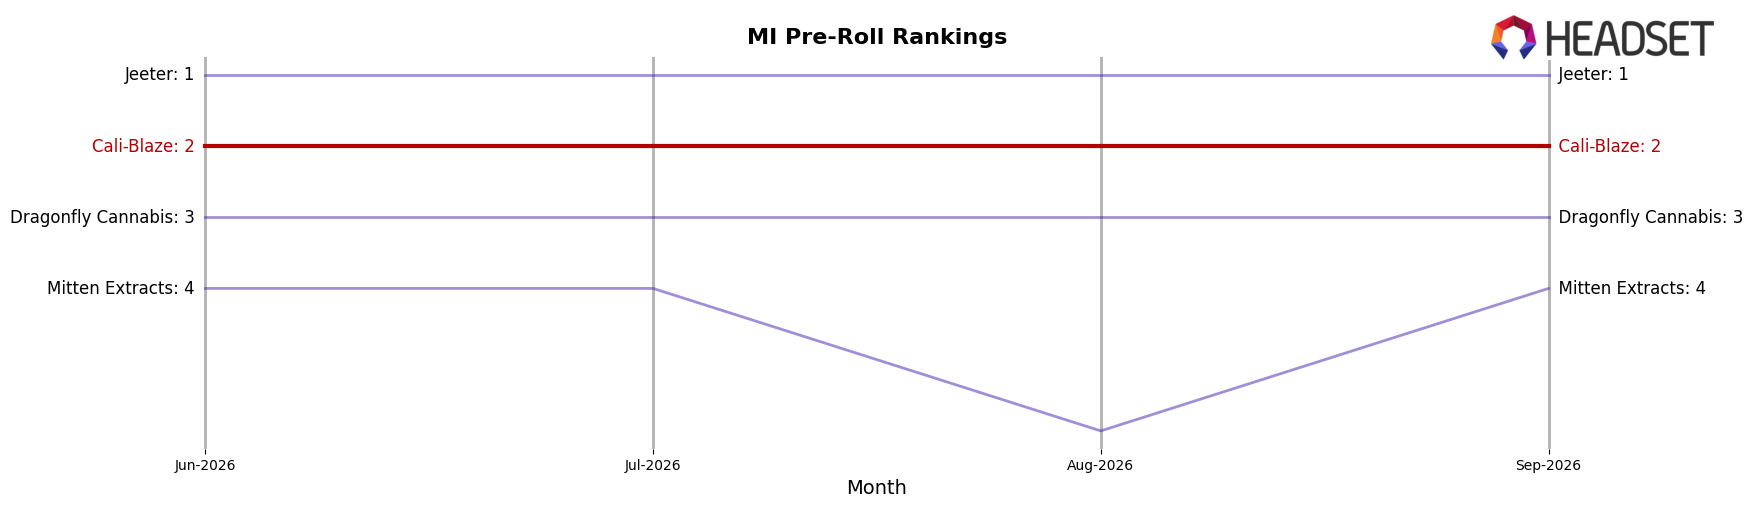
Cali-Blaze holds rank #2 in MI Pre-Roll in September 2026, unchanged from #2 in September 2025, and it also stayed #2 over the last three months, indicating a flat rank trajectory while the category reordered around it; Jeeter remained #1 YoY and current, while Mitten Extracts climbed from #5 to #4 and Goodlyfe Farms slipped from #4 to #5 with a -22.3% YoY sales change, implying Cali-Blaze’s ceiling at #2 persists unless it converts competitor volatility into share capture.
Notable Products
Blue Muffin Liquid Diamond Infused Pre-Roll (1.2g) posted the steepest movement in September 2026 with a -19.7% month-over-month drop while slipping to rank 7, contrasted against Tarantula - Cotton Candy Infused Pre-Roll (1g) rising +28.5% to rank 5 and Tarantula - Tropical Smoothie Infused Pre-Roll (1.2g) up +14.8% at rank 1. Three Tarantula SKUs sit within the top five ranks (1, 4, and 5), and eight of the top ten are Pre-Roll variants from the same family, indicating a concentration that favors flavored infused formats over broader variety. Strawberry Lemonade Infused Pre-Roll (1.2g) added +15.8% MoM at rank 3 while Blueberry Infused Donut Blunt (1.2g) declined -6.0% at rank 10, with the top product generating $104,684. The pattern implies Cali-Blaze is leaning into Tarantula-led, flavor-forward Pre-Rolls as the commercial core, with selective pruning likely for underperforming liquid diamond lines.
Top Selling Cannabis Brands






Data for this report comes from real-time sales reporting by participating cannabis retailers via their point-of-sale systems, which are linked up with Headset’s business intelligence software. Headset’s data is very reliable, as it comes digitally direct from our partner retailers. However, the potential does exist for misreporting in the instance of duplicates, incorrectly classified products, inaccurate entry of products into point-of-sale systems, or even simple human error at the point of purchase. Thus, there is a slight margin of error to consider. Brands listed on this page are ranked in the top twenty within the market and product category by total retail sales volume.

