.svg)
Sep-2026
Sales
Trend
6-Month
Product Count
SKUs
Avg Price
YoY Sales Change
YoY Price Change


Where to Buy
Almora Farms is stocked at 390 licensed dispensaries across California, with the deepest coverage in Los Angeles, Sacramento, San Diego, San Francisco, and San Jose. Search by ZIP code or city below to find the closest one, or filter by product type if you are after a specific format.
Market Insights Snapshot
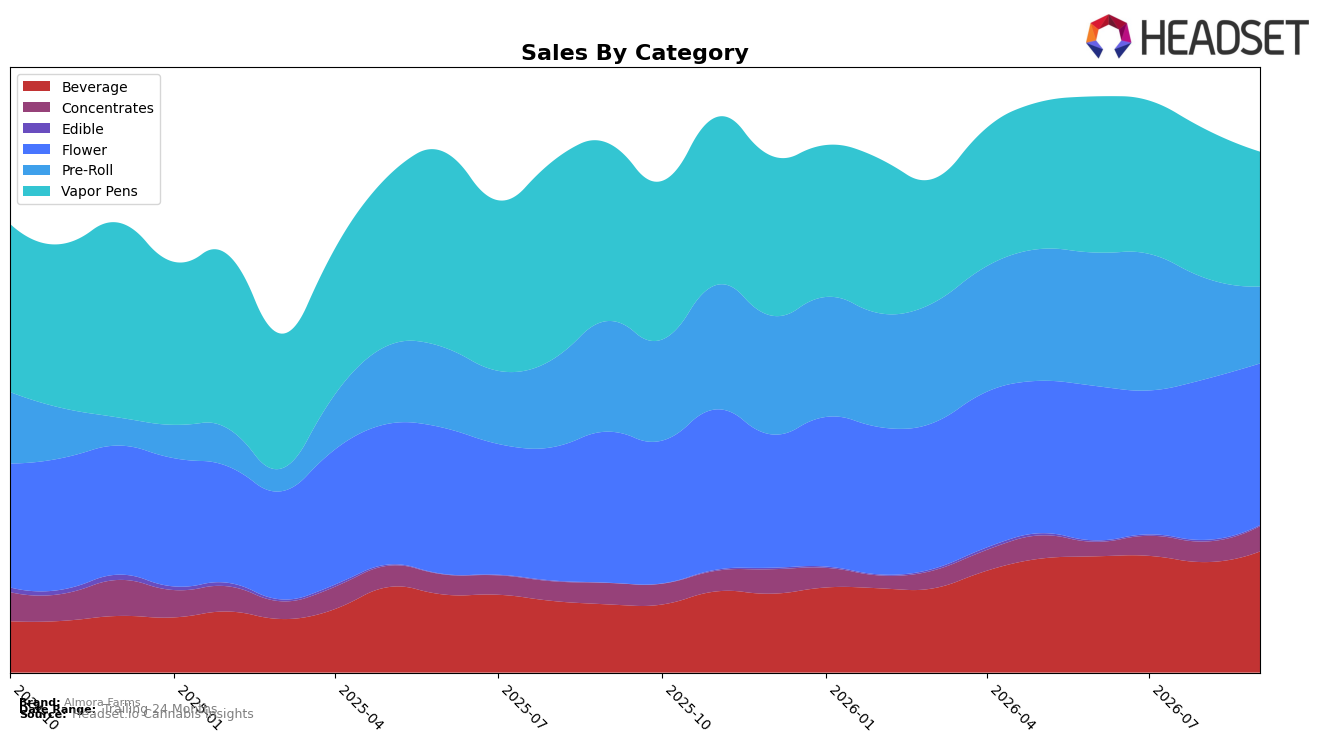
Almora Farms concentrated revenue in three categories in September 2026: Flower at 30.80% share with 6.95% year-over-year growth and 0.67% month-over-month growth, Vapor Pens at 25.72% share with -24.01% year-over-year and -9.45% month-over-month declines, and Beverage at 23.15% share with 76.06% year-over-year and 9.51% month-over-month gains. Pre-Roll contracted to 14.81% share with -30.01% year-over-year and -23.78% month-over-month declines, while Concentrates rose to 5.04% share with 16.61% year-over-year and 21.38% month-over-month gains; Edible remained small at 0.47% share with 54.02% year-over-year growth but an -18.53% month-over-month dip. The mix shift implies risk transfer away from Vapor Pens and Pre-Roll toward Beverage and Concentrates, with Flower stabilizing the base, which aligns with a modest brand-level year-over-year sales change of -1.57% alongside a 17.14% year-over-year decline in average price.
With Flower ranked 34th in California and holding 30.80% of brand sales, the slight month-over-month Flower uptick of 0.67% combined with Beverage’s 9.51% month-over-month lift suggests near-term positioning built on a value-accessible entry (average price $16.86 overall, down 17.14% year-over-year) plus a fast-scaling Beverage line growing 76.06% year-over-year. The sharp month-over-month declines in Vapor Pens (-9.45%) and Pre-Roll (-23.78%) offset by Concentrates’ 21.38% month-over-month rise point to a pivot toward categories with clearer price elasticity and basket-expansion roles, implying Almora Farms can defend share through Flower stability while using Beverage and Concentrates as acquisition and cross-sell engines.
Competitive Landscape
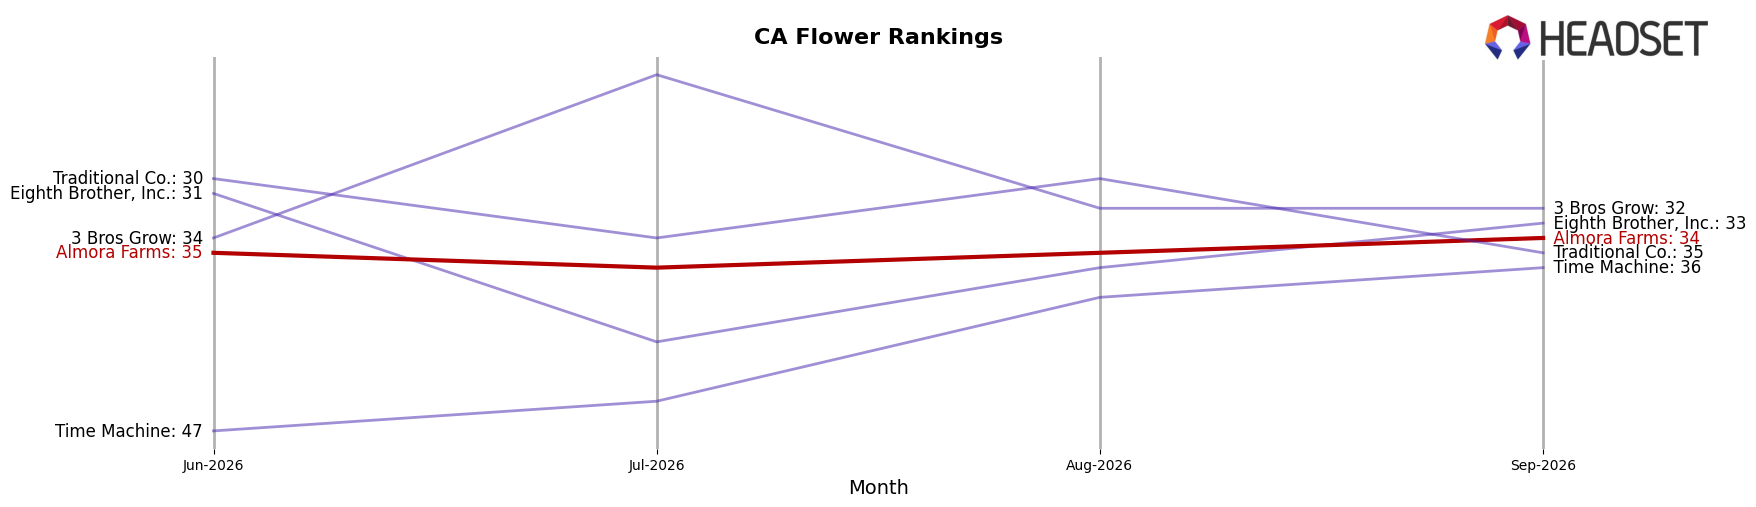
Almora Farms sits at rank 34 in California Flower for September 2026, unchanged from rank 34 year over year, while moving up 1 position from June 2026’s rank 35 and still trailing its peak rank 30 from November 2025; in contrast, STIIIZY climbed from rank 2 to rank 1 with 47.8% year-over-year sales growth and CAM advanced from rank 3 to rank 2 with 28.9% growth, whereas CannaBiotix (CBX) slid from rank 1 to rank 3 alongside a 21.1% sales decline; this stability at rank 34 alongside competitors’ upward and downward churn implies Almora Farms is holding share in a tightening top tier but needs a catalyst to reapproach rank 30.
Notable Products
Sativa Pre Ground (28g) posted the sharpest movement in September 2026 with a +37.98% month-over-month change at rank 6, while OG Classic Live Resin Lemonade (100mg THC, 12oz) slid -4.76% at rank 3. Prebiotic Strawberry Live Resin Lemonade (100mg THC,12oz) held rank 1 despite a -2.26% dip, and Pomberry Rose Live Resin Lemonade (100mg THC,12oz) in rank 2 inched up +0.58%, signaling stability at the very top even as the mid-pack Flower SKU accelerated. With five Beverages in the top 5 and three Flower SKUs clustered at ranks 6–8, the mix points to Beverage-led traffic with rising contribution from value Flower formats, implying Almora Farms is leveraging drinks for visibility while expanding basket size through bulk Flower.
Top Selling Cannabis Brands






Data for this report comes from real-time sales reporting by participating cannabis retailers via their point-of-sale systems, which are linked up with Headset’s business intelligence software. Headset’s data is very reliable, as it comes digitally direct from our partner retailers. However, the potential does exist for misreporting in the instance of duplicates, incorrectly classified products, inaccurate entry of products into point-of-sale systems, or even simple human error at the point of purchase. Thus, there is a slight margin of error to consider. Brands listed on this page are ranked in the top twenty within the market and product category by total retail sales volume.

