.svg)

Sep-2026
Sales
Trend
6-Month
Product Count
SKUs
Avg Price
YoY Sales Change
YoY Price Change


Where to Buy
Lagunitas is stocked at 88 licensed dispensaries across California, with the deepest coverage in Los Angeles, San Francisco, San Jose, San Diego, and Encinitas. Search by ZIP code or city below to find the closest one, or filter by product type if you are after a specific format.
Market Insights Snapshot
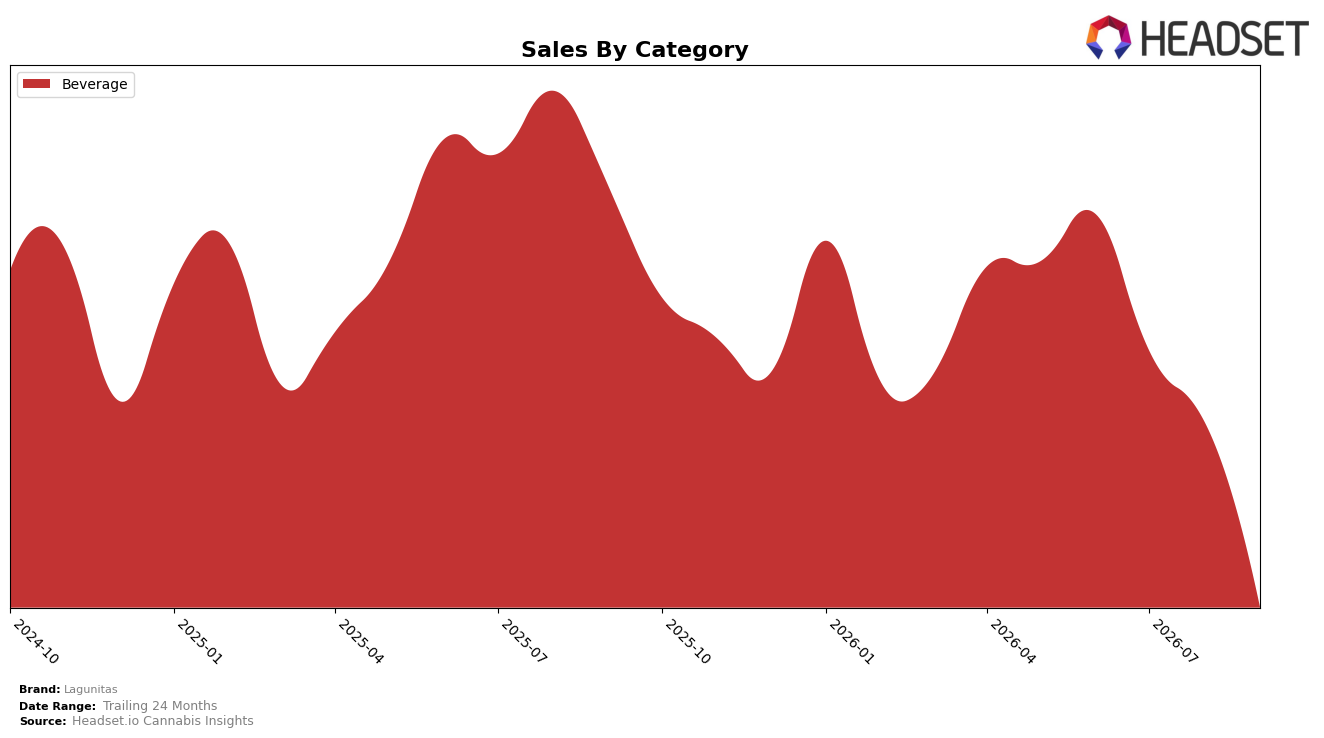
In September 2026, Lagunitas operated as a single-category brand with Beverage at 100.0% of mix, posting a year-over-year decline of 59.8% alongside a month-over-month drop of 39.6%; the category’s average price moved to $8.63 with a 34.9% YoY decrease and aligns with the brand’s overall price compression. Within California Beverage, Lagunitas held rank 9 while experiencing a 59.8% YoY contraction and a 39.6% MoM contraction, implying that the brand is consolidating volume at lower price points rather than diversifying categories.
The combination of a 100.0% Beverage concentration and a 34.9% YoY price decrease indicates a strategy leaning on price-accessible packs to retain buyers, yet the simultaneous 59.8% YoY and 39.6% MoM sales declines suggest that price elasticity is unfavorable at current positioning. Holding rank 9 in California while contracting at these rates implies that Lagunitas’s current Beverage-only focus may be ceding share to differentiated formats within the same category, pointing to a need for pack-size or format innovation rather than further price cuts.
Competitive Landscape
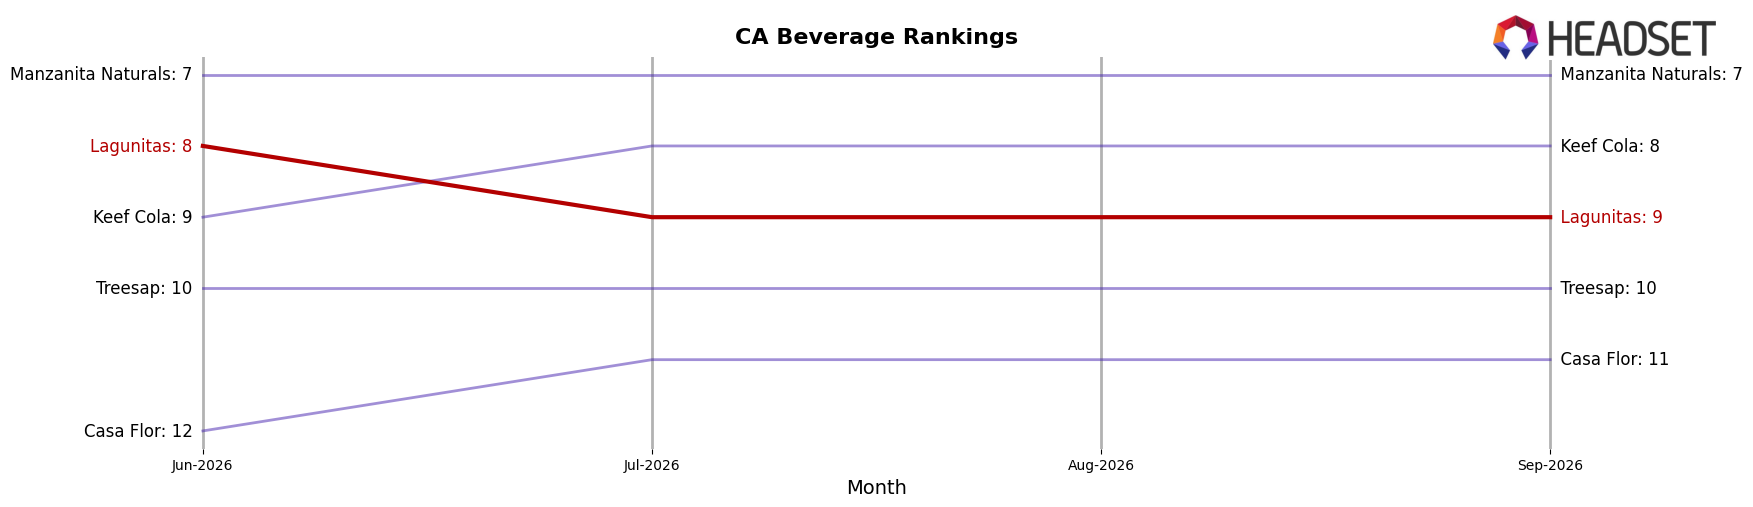
Lagunitas sits at rank #9 in CA Beverage as of September 2026, down 2 positions YoY from #7, and 1 position lower than June 2026’s #8; its peak rank of #7 in September 2025 underscores a two-spot slide over 12 months. In contrast, Almora Farms moved up from #6 to #4 while posting a 76% YoY sales increase, and CANN Social Tonics climbed from #9 to #5 with a 341% YoY sales gain, indicating share is consolidating above Lagunitas; meanwhile, category leaders like St Ides held #1 year-over-year with a 15% YoY increase that keeps the top stable. The pattern implies Lagunitas is ceding rank to faster-rising peers and must reverse a 1-position decline since June 2026 and a 2-position YoY drop to avoid further erosion against brands accelerating into the top 5.
Notable Products
Hi-Fi Sessions - Hoppy Chill Sparkling Water 10-Pack (100mg THC, 12oz, 355ml) posted the steepest decline in September 2026 at -66.9% MoM while sliding to rank 9, and the single-serve Hi-Fi Sessions - Hoppy Chill Sparkling Water (10mg THC, 12oz, 355ml) fell -61.7% MoM at rank 4. At the top, HiFi Sessions - Mango Sparkling Water (10mg THC, 12oz, 355ml) held rank 1 despite a -31.7% MoM drop, and its 4-Pack counterpart at rank 5 was down -16.3% MoM with $12,032 in sales. With all top-10 SKUs in Beverage and multiple Hoppy variants retreating over -55%, the pattern implies a pivot away from high-dose multipacks toward lower-dose singles that can still anchor share even amid category-wide softness.
Top Selling Cannabis Brands






Data for this report comes from real-time sales reporting by participating cannabis retailers via their point-of-sale systems, which are linked up with Headset’s business intelligence software. Headset’s data is very reliable, as it comes digitally direct from our partner retailers. However, the potential does exist for misreporting in the instance of duplicates, incorrectly classified products, inaccurate entry of products into point-of-sale systems, or even simple human error at the point of purchase. Thus, there is a slight margin of error to consider. Brands listed on this page are ranked in the top twenty within the market and product category by total retail sales volume.

