.svg)



Where to Buy
Canna Confections is stocked at 17 licensed dispensaries across Arizona and Alaska, 13 of them in Arizona, with the deepest coverage in Phoenix, Mesa, Buckeye, El Mirage, and Guadalupe. Search by ZIP code or city below to find the closest one.
Market Insights Snapshot
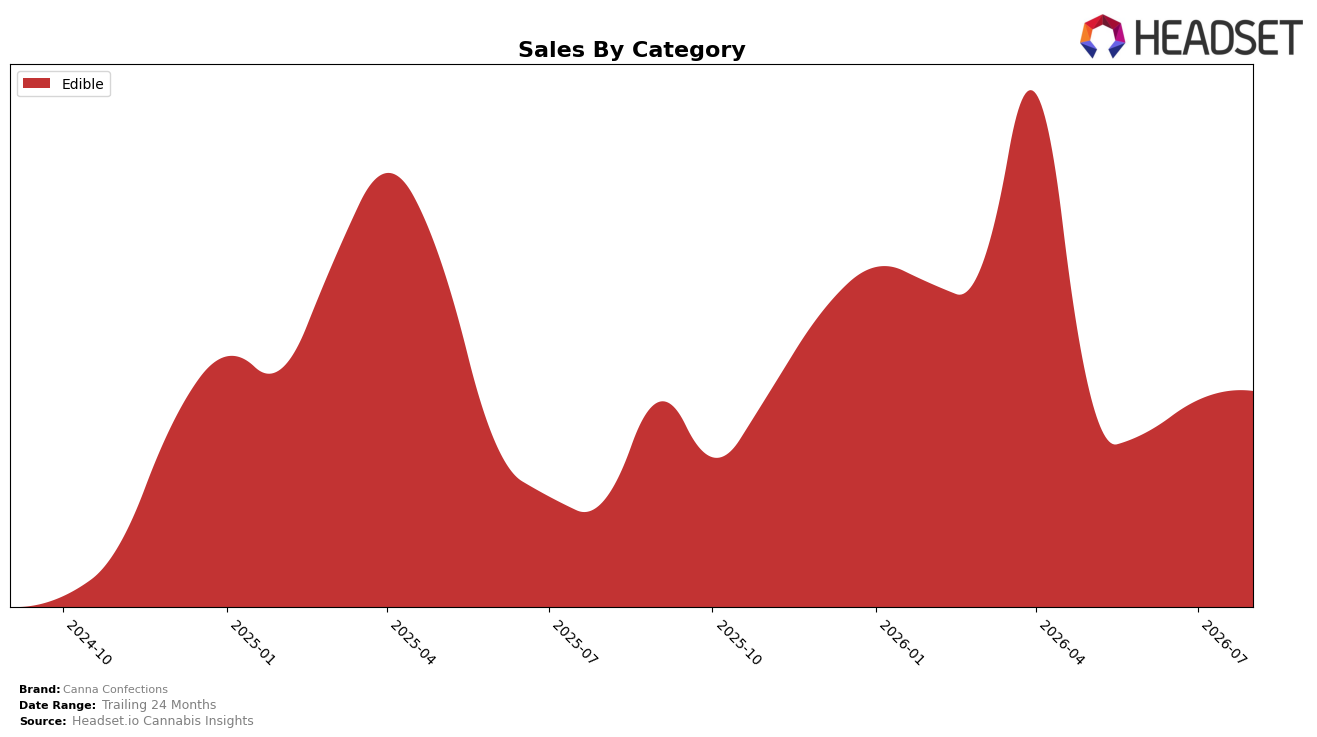
In August 2026, Canna Confections operated as a single-category brand, with Edible accounting for 100.0% of sales and a month-over-month change of 2.6% alongside a year-over-year change of 44.0%. Average price moved to $11.77 with a year-over-year decline of 10.2%, while the Edible category’s share remained at 100.0% and monthly sales grew 2.6%. The pairing of expanding volume implied by the 44.0% year-over-year lift and a 10.2% price contraction indicates the brand is leaning into price elasticity to capture incremental units within Arizona Edibles.
Canna Confections held rank 38 in Edibles in Arizona, and the 2.6% month-over-month uptick coupled with a 44.0% year-over-year increase suggests share gains are being pursued through value positioning rather than premiumization. With 100.0% of mix in Edibles and a 10.2% average price reduction year over year, the current trajectory points to a volume-led strategy that prioritizes shelf breadth and repeat purchase over cross-category expansion, implying near-term competitiveness will hinge on maintaining unit velocity at rank 38 while defending margin at the $11.77 price point.
Competitive Landscape
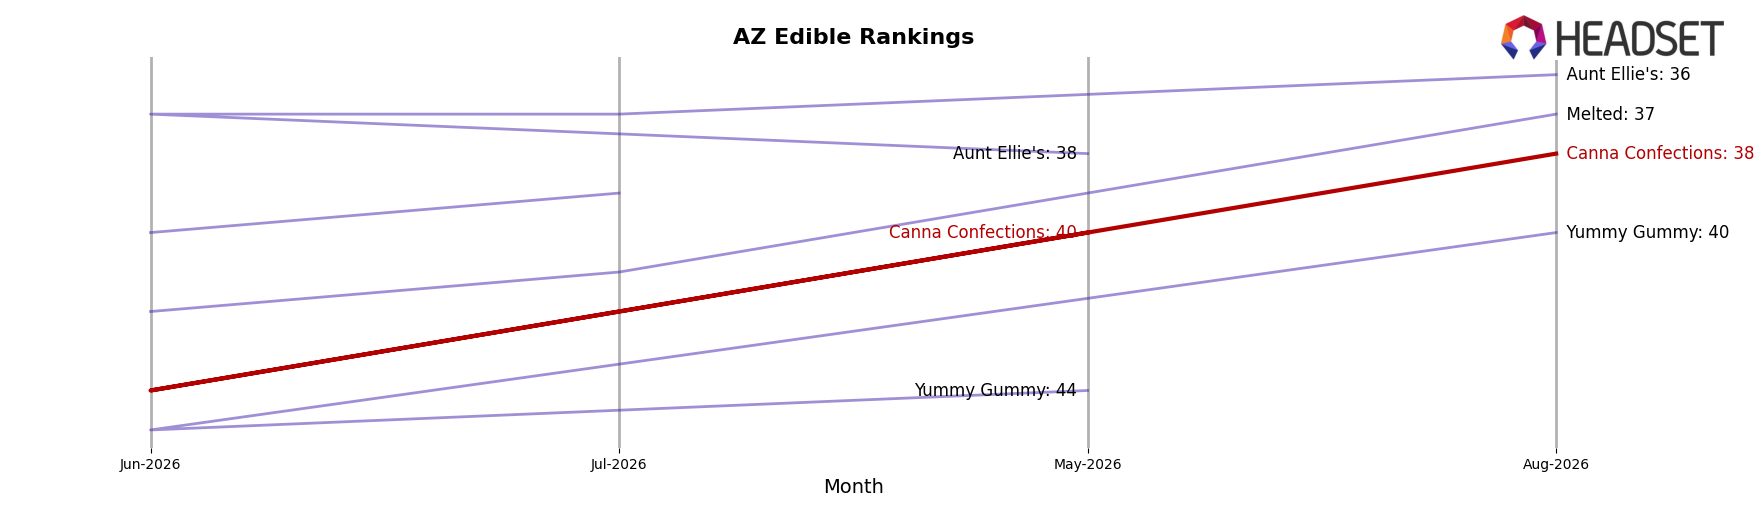
Canna Confections sits at rank 38 in AZ Edible for August 2026, improving 9 positions from rank 47 year over year, while sliding 2 spots from rank 36 at its April 2026 peak. Over the shorter horizon it dipped 2 ranks from 40 in May 2026 to 38 in August 2026, whereas Wyld held rank 1 with a -19.2% year-over-year sales change and OGEEZ remained at rank 2 with +2.8% year-over-year growth. Against this backdrop, the combination of a 9-place year-over-year climb and a near-peak ceiling at rank 36 implies Canna Confections is breaking into the mid-tier but still lacks the acceleration to challenge the top 20 without a step-change in velocity.
Notable Products
Indica Vanilla Caramels 10-Pack (100mg) posted the headline move in August 2026 with a +11,088% month-over-month surge, vaulting to rank 2, while Indica Milk Chocolate Bar (100mg) fell -20% to rank 3. The top slot remained Indica Dark Chocolate Bar (100mg) at rank 1 with +13.7% MoM, and four of the top ten are Edible bars, concentrating share at the top as five Flower Pop candies plunged between -79% and -95% into ranks 6–10. With caramels eclipsing $2,700 and bars holding ranks 1–3, the mix points to a pivot away from novelty candies toward higher-dosage, classic confections that can anchor premium basket roles.
Top Selling Cannabis Brands






Data for this report comes from real-time sales reporting by participating cannabis retailers via their point-of-sale systems, which are linked up with Headset’s business intelligence software. Headset’s data is very reliable, as it comes digitally direct from our partner retailers. However, the potential does exist for misreporting in the instance of duplicates, incorrectly classified products, inaccurate entry of products into point-of-sale systems, or even simple human error at the point of purchase. Thus, there is a slight margin of error to consider. Brands listed on this page are ranked in the top twenty within the market and product category by total retail sales volume.

