.svg)


Market Insights Snapshot
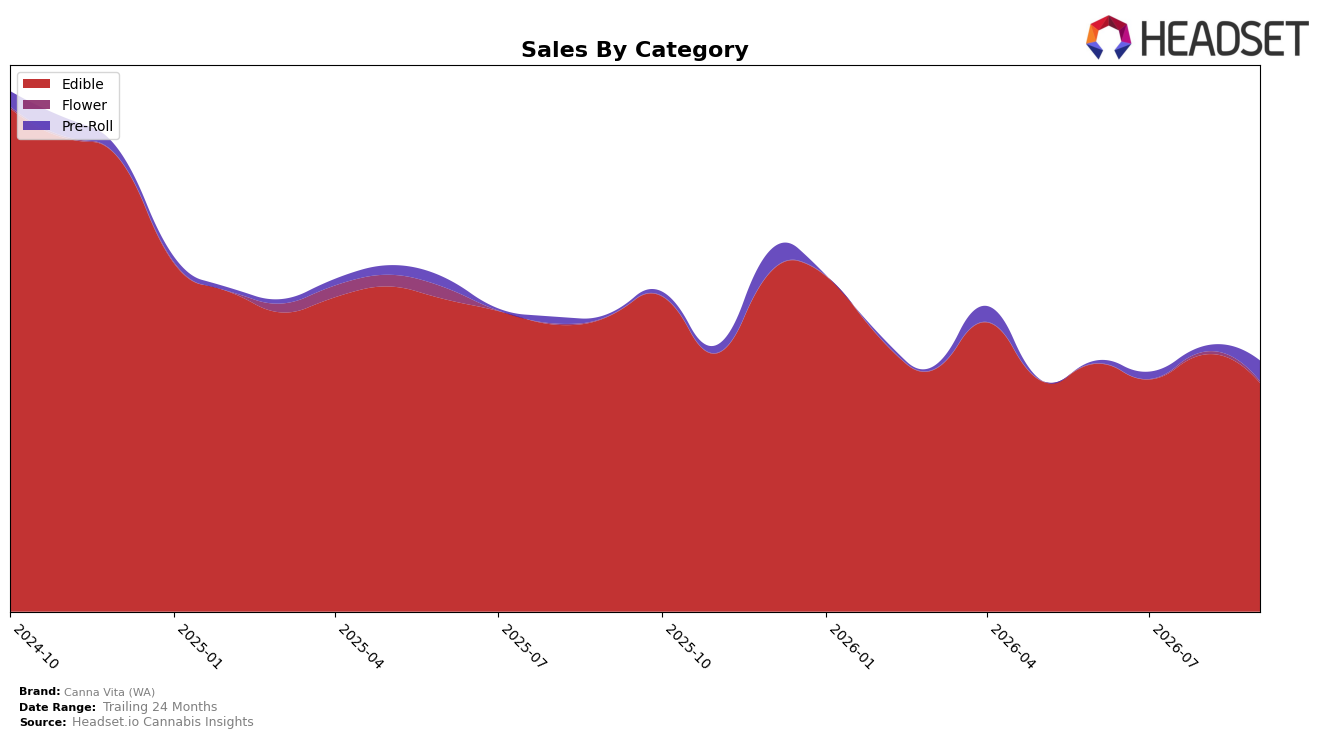
Canna Vita (WA) concentrated 91.33% of September 2026 sales in Edible, where category revenue fell 22.57% year over year and 11.11% month over month, while the brand’s overall sales declined 15.75% year over year and 46.70% over 24 months. Pre-Roll expanded to 8.09% share on 998.75% year-over-year growth and 276.82% month-over-month growth, contrasted with Flower shrinking to 0.58% share with a 39.50% month-over-month drop and no year-over-year basis. With Edible ranked 44th in Washington and average price up 0.73% year over year to $9.26, the mix shift indicates reliance on a contracting Edible base while a small but rapidly scaling Pre-Roll line is absorbing some of the Edible softness.
The divergence between a 22.57% Edible year-over-year decline and a 998.75% Pre-Roll surge implies the brand is pivoting toward a higher-velocity format without yet offsetting the 11.11% month-over-month Edible pullback. Given the 44 rank in Washington Edible and a 276.82% month-over-month lift in Pre-Roll, the brand’s positioning skews toward defending a legacy Edible footprint while testing Pre-Roll as a growth wedge, with pricing stability (+0.73% year over year) signaling limited price-led recovery and a need to lean on mix and velocity gains rather than discounting.
Competitive Landscape
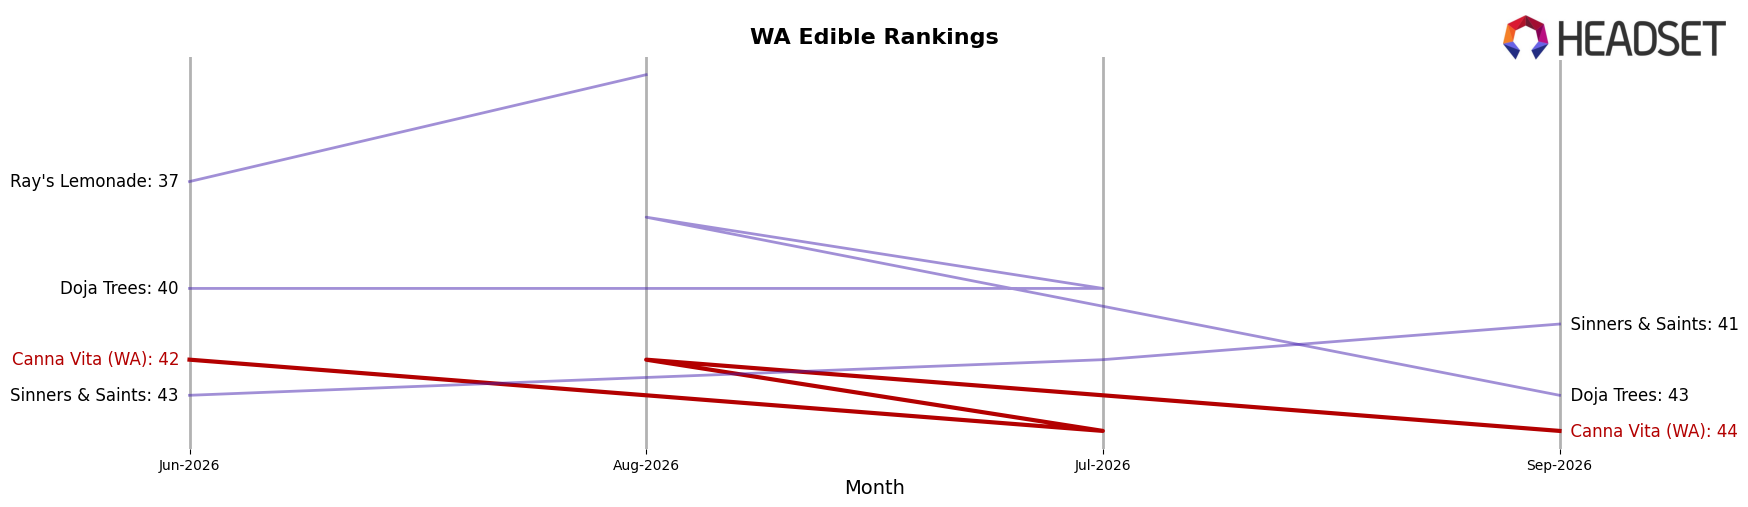
Canna Vita (WA) sits at rank #44 in WA Edible in September 2026, down 2 spots YoY from #42, while also slipping 2 positions since June 2026 from #42 to #44; this contrasts with Wyld holding #1 both YoY and currently with 6.0% YoY sales growth and Green Revolution staying at #2 despite a -3.1% YoY sales change. Against its own history, Canna Vita (WA) is 11 ranks below its October 2024 peak of #33 and 2 ranks below its three-month mark of #42, whereas Hot Sugar maintained #3 YoY to current with a 1.7% YoY sales lift; this pattern implies a slide from prior peak positioning and a need to reverse incremental rank losses as stable top-tier competitors consolidate share.
Notable Products
Dark Chocolate Mint Sugar Free Candies (100mg) posted the largest movement in September 2026 with a +78.6% month-over-month surge to rank 2, while CBD Milk Chocolate Squares 10-Pack (100mg CBD) fell -11.3% but still held rank 1, indicating mix-shift rather than category exit. Dark Chocoate Espresso (100mg) dropped -35.4% and slid to rank 2 territory alongside the sugar-free SKU, and five of the top ten are Corner Stone or Cornerstone variants clustered between ranks 3 and 7, pointing to a portfolio tilted toward multiple niche chocolate formats. The combined pattern—one sugar-free SKU escalating rapidly and legacy milk chocolate softening—implies Canna Vita (WA) is leaning into differentiated formulations to defend share within Edibles rather than relying on a single flagship.
Top Selling Cannabis Brands






Data for this report comes from real-time sales reporting by participating cannabis retailers via their point-of-sale systems, which are linked up with Headset’s business intelligence software. Headset’s data is very reliable, as it comes digitally direct from our partner retailers. However, the potential does exist for misreporting in the instance of duplicates, incorrectly classified products, inaccurate entry of products into point-of-sale systems, or even simple human error at the point of purchase. Thus, there is a slight margin of error to consider. Brands listed on this page are ranked in the top twenty within the market and product category by total retail sales volume.

