Jun-2026
Sales
Trend
6-Month
Product Count
SKUs
Avg Price
YoY Sales Change
YoY Price Change
Market Insights Snapshot
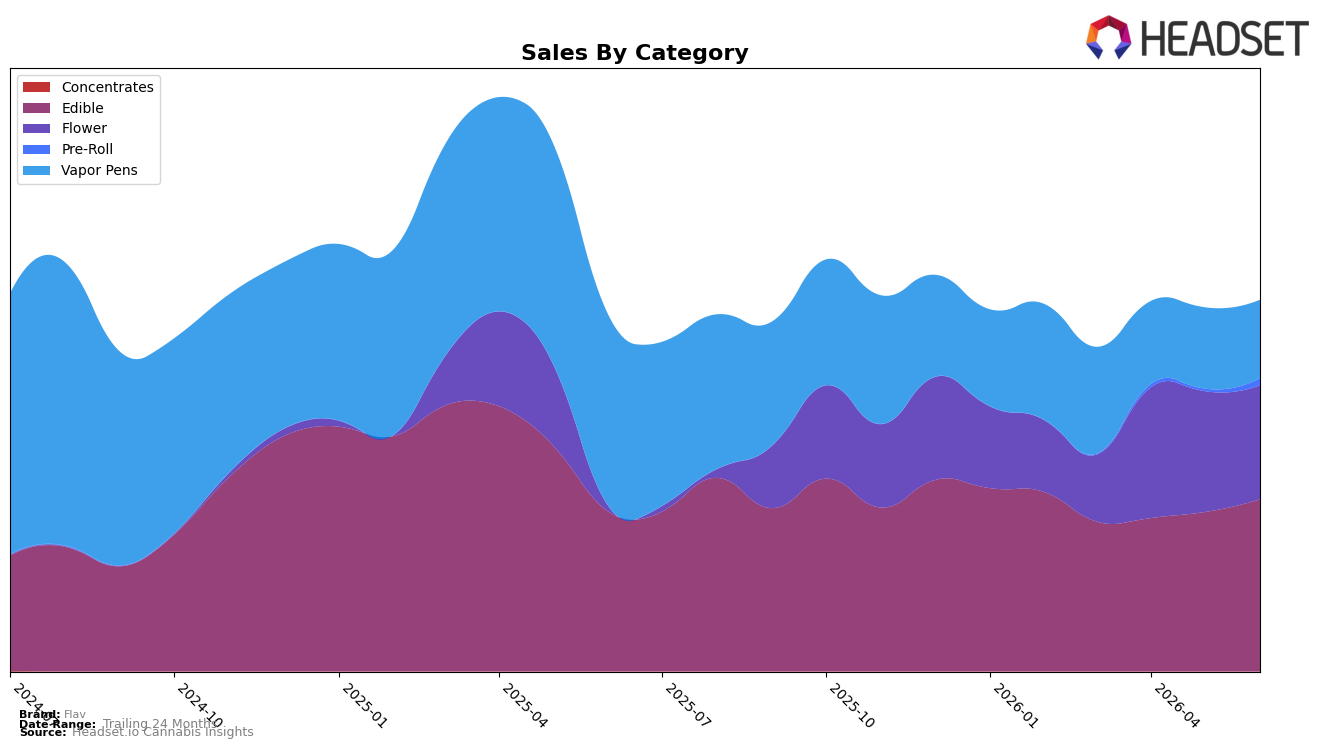
June 2026 mix skewed toward Edible at 46.35% share with 7.61% YoY growth and 7.96% MoM, while Flower climbed to 30.73% share on a 2,052.12% YoY surge but slipped 5.61% MoM; Vapor Pens fell to 21.09% share with -59.02% YoY and -3.55% MoM, and Pre-Roll held 1.83% share with a 195.59% MoM jump off a negligible base (no YoY). Despite average price down 3.67% YoY to $17.53 and brand sales up 4.19% YoY, the 16.16% decline versus 24 months ago indicates the June 2026 rebound is concentrated in a narrower set of categories, implying reliance on Edible stability and a recent Flower spike rather than broad-based recovery.
The mix shift implies Flav is repositioning away from Vapor Pens toward Edible and Flower: Vapor Pens’ -59.02% YoY and -3.55% MoM suggest shrinking consumer pull, while Edible’s 7.61% YoY and 7.96% MoM alongside Flower’s 2,052.12% YoY but -5.61% MoM point to a portfolio balancing act between steady edible demand and volatile flower momentum. With Flower ranked 46 in Missouri and Flower now the top category by rank context but only 30.73% share in the mix, the brand’s near-term positioning leans on Edible to smooth revenue while testing Flower for incremental share gains; the pattern suggests June 2026 prioritizes margin defense via lower prices (-3.67% YoY) and targeted category bets rather than a uniform push across formats.
Competitive Landscape
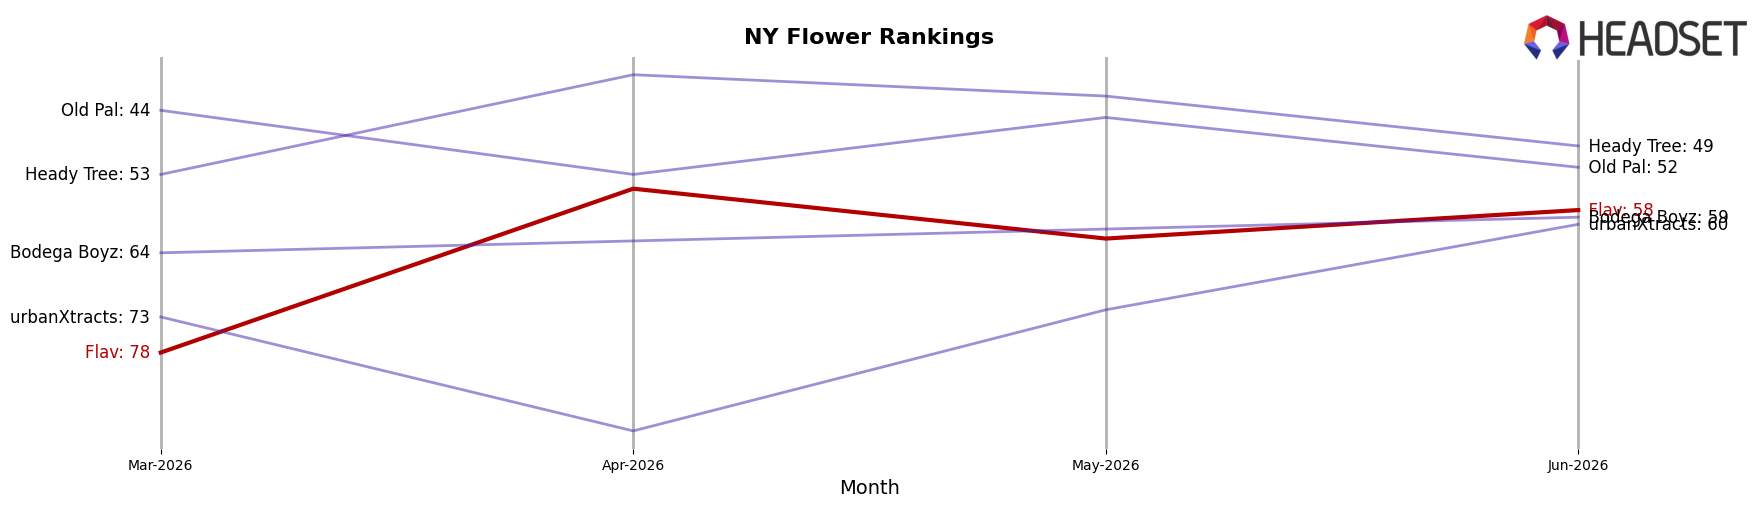
Flav sits at rank #58 in June 2026 in NY Flower, improving 169 positions year over year from #227, and rising 20 spots from #78 in March 2026 while still trailing its peak of #36 from April 2025; in contrast, Find. moved up from #3 to #1 and RYTHM advanced from #10 to #5, indicating that top-tier competitors are consolidating share faster than mid-pack movers. This pattern implies Flav’s rank trajectory is upward but capped by accelerating gains at the top, so maintaining momentum from #78 to #58 requires strategies that convert episodic lifts into sustained climbs toward the #36 range.
Notable Products
The steepest decline came from Sour Mango Live Resin Mega Gummy Belts (100mg), down 17.7% and sitting at rank 6, while Watermelon Live Resin Gummy Belts 10-Pack (100mg) fell 10.2% at rank 9, indicating softness in certain Mega and Watermelon formats. Offsetting that, Sour Rainbow Mega Live Resin Gummy Belt (100mg) surged 22.9% to rank 4 and Peach Mega Dosed Gummy Rings 2-Pack (100mg) jumped 38.4% at rank 7, suggesting selective momentum within Mega SKUs despite the mixed picture. Rainbow Sour Live Resin Gummy Belts 10-Pack (100mg) held rank 1 with a 7.1% MoM lift and Strawberry Live Resin Gummy Belts 10-Pack (100mg) rose 9.3% at rank 3, and with eight of the top ten being Edible gummy belts or rings, product concentration remains high. The pattern implies Flav is leaning into live resin gummies where classic 10-packs anchor share, while targeted Mega variants drive incremental upside and expose format-specific volatility.
Top Selling Cannabis Brands
Data for this report comes from real-time sales reporting by participating cannabis retailers via their point-of-sale systems, which are linked up with Headset’s business intelligence software. Headset’s data is very reliable, as it comes digitally direct from our partner retailers. However, the potential does exist for misreporting in the instance of duplicates, incorrectly classified products, inaccurate entry of products into point-of-sale systems, or even simple human error at the point of purchase. Thus, there is a slight margin of error to consider. Brands listed on this page are ranked in the top twenty within the market and product category by total retail sales volume.

