.svg)

Aug-2026
Sales
Trend
6-Month
Product Count
SKUs
Avg Price
YoY Sales Change
YoY Price Change


Market Insights Snapshot
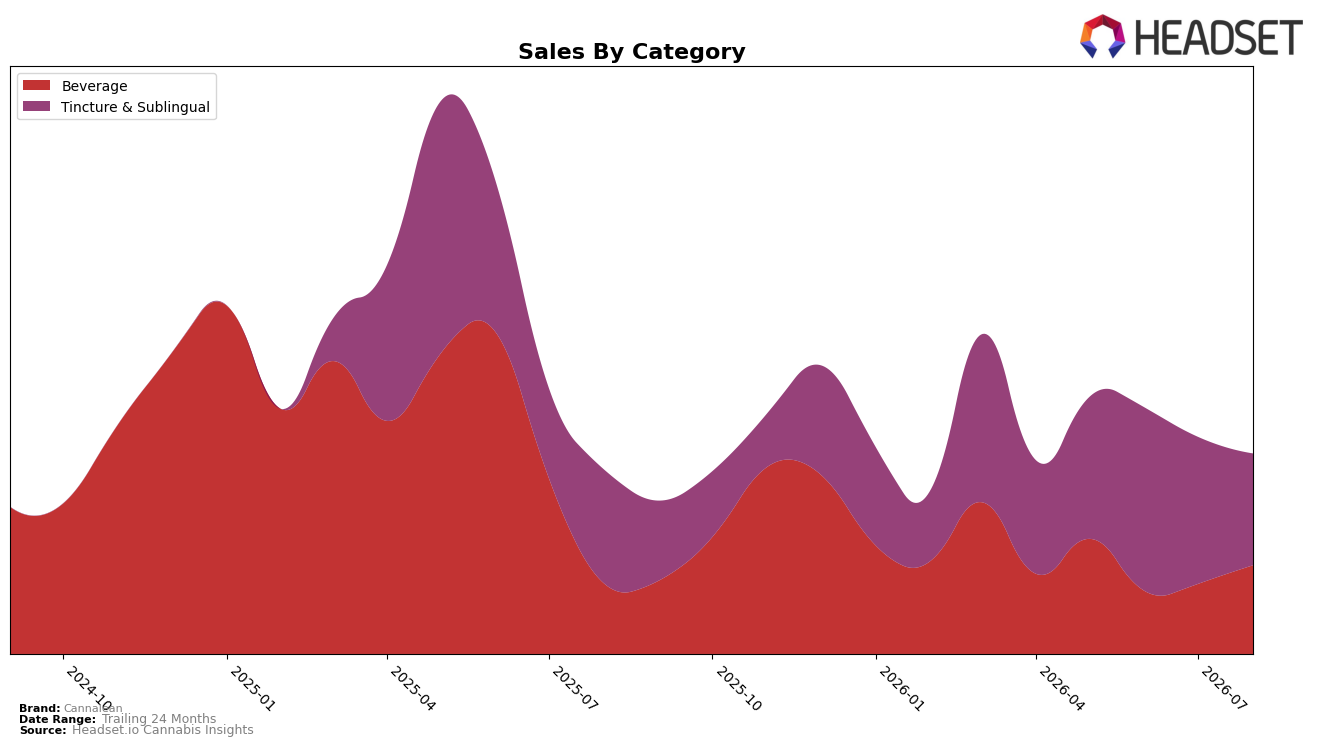
Cannalean’s mix in August 2026 tilted toward Tincture & Sublingual at 55.79% share while Beverage accounted for 44.21%, marking a month-over-month divergence where Tincture & Sublingual fell 24.03% and Beverage rose 26.78%. Year over year, Beverage expanded 25.85% as Tincture & Sublingual contracted 1.88%, with the average brand price down 0.57% amid overall brand sales up 8.71% YoY; this implies Cannalean is relying less on Tincture & Sublingual volume in the short term despite it remaining the largest share, while Beverage is becoming the incremental growth engine.
The shift suggests Cannalean’s positioning is migrating toward a two-pillar portfolio where Beverage absorbs near-term demand volatility and Tincture & Sublingual anchors awareness, a pattern reinforced by a 26.78% MoM Beverage surge against a 24.03% MoM Tincture & Sublingual dip. With Tincture & Sublingual share still at 55.79% and Beverage growing faster at 25.85% YoY versus a 1.88% YoY decline, Cannalean’s pricing latitude (average price down 0.57%) indicates headroom to trade consumers into Beverage without eroding the Tincture & Sublingual base, implying a pragmatic rebalancing toward formats driving incremental trips rather than deepening reliance on its legacy leader.
Competitive Landscape
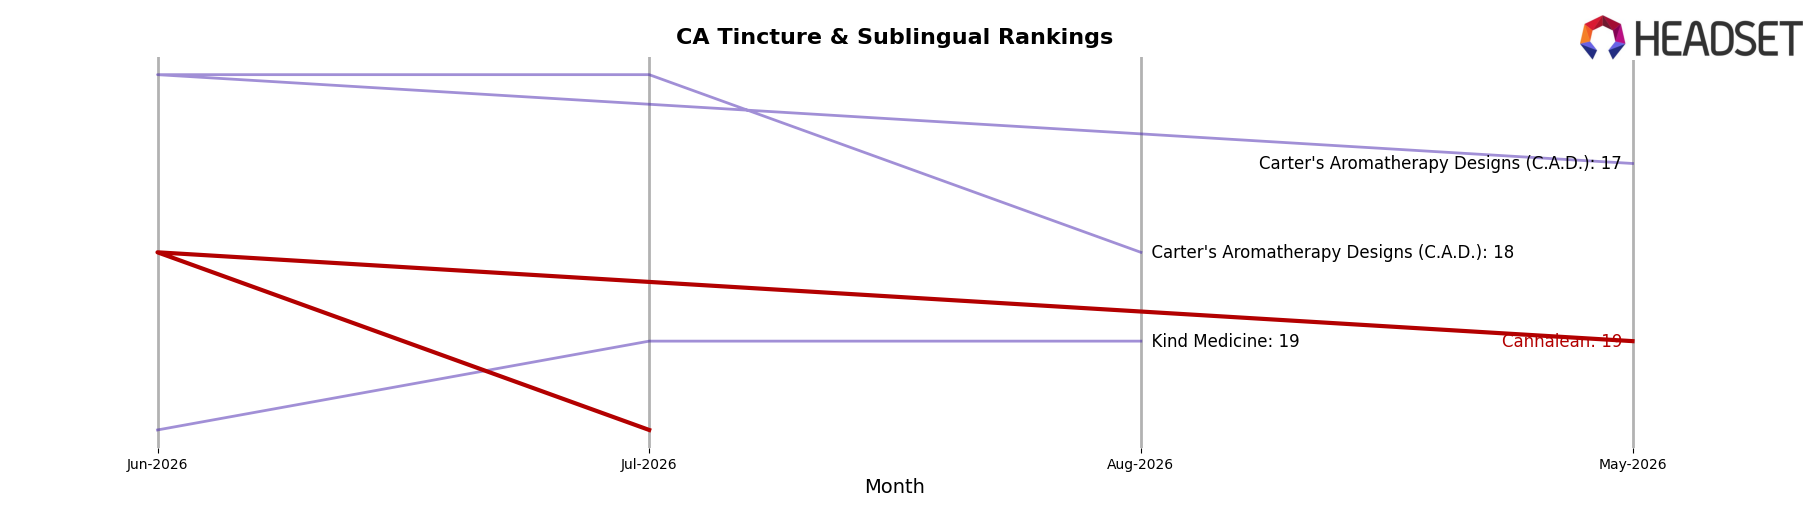
Cannalean sits at rank 20 in CA Tincture & Sublingual for August 2026, a 1-place improvement from rank 21 year over year but a 1-place decline from rank 19 three months ago; its best position this year was rank 18 in June 2026. Against top-tier competitors, Papa & Barkley held steady at rank 1 with a -1.36% year-over-year sales change while Yummi Karma maintained rank 2 with a 15.09% year-over-year sales increase, indicating Cannalean’s marginal 1-rank YoY climb is not closing the gap on leaders who are either holding rank or expanding sales. The pattern implies Cannalean’s trajectory is stabilizing around the high teens to low twenties rather than breaking into the top 15 without a step-change in momentum.
Notable Products
Pink Glow Tincture (1000mg THC, 60ml) plunged by -60.5% month over month to rank 5, while Mango Mochi Tincture (1000mg THC, 60ml) surged 201.2% to rank 2 in August 2026. Guava Punch Tincture (1000mg THC, 60ml) held rank 1 despite a -7.9% slip, indicating the leadership position is intact even as mix shifts toward Mango Mochi Tincture. The product slate shows four of the top ten are Beverage SKUs, yet two Beverage leaders fell sharply with Mango Mochi Syrup (1000mg THC, 60ml, 2oz) down -36.4% at rank 3 and Strawblurry Extra Strength Syrup (1000mg THC, 60ml) down -11.8% at rank 4, suggesting consumer pull is concentrating in Tinctures over Syrups. The pattern implies Cannalean is consolidating growth in higher-conversion Tinctures while culling or repositioning lagging Syrups, with a likely reallocation of shelf and promo dollars toward Mango Mochi Tincture.
Top Selling Cannabis Brands






Data for this report comes from real-time sales reporting by participating cannabis retailers via their point-of-sale systems, which are linked up with Headset’s business intelligence software. Headset’s data is very reliable, as it comes digitally direct from our partner retailers. However, the potential does exist for misreporting in the instance of duplicates, incorrectly classified products, inaccurate entry of products into point-of-sale systems, or even simple human error at the point of purchase. Thus, there is a slight margin of error to consider. Brands listed on this page are ranked in the top twenty within the market and product category by total retail sales volume.

