May-2026
Sales
Trend
6-Month
Product Count
SKUs
Avg Price
YoY Sales Change
YoY Price Change
Market Insights Snapshot
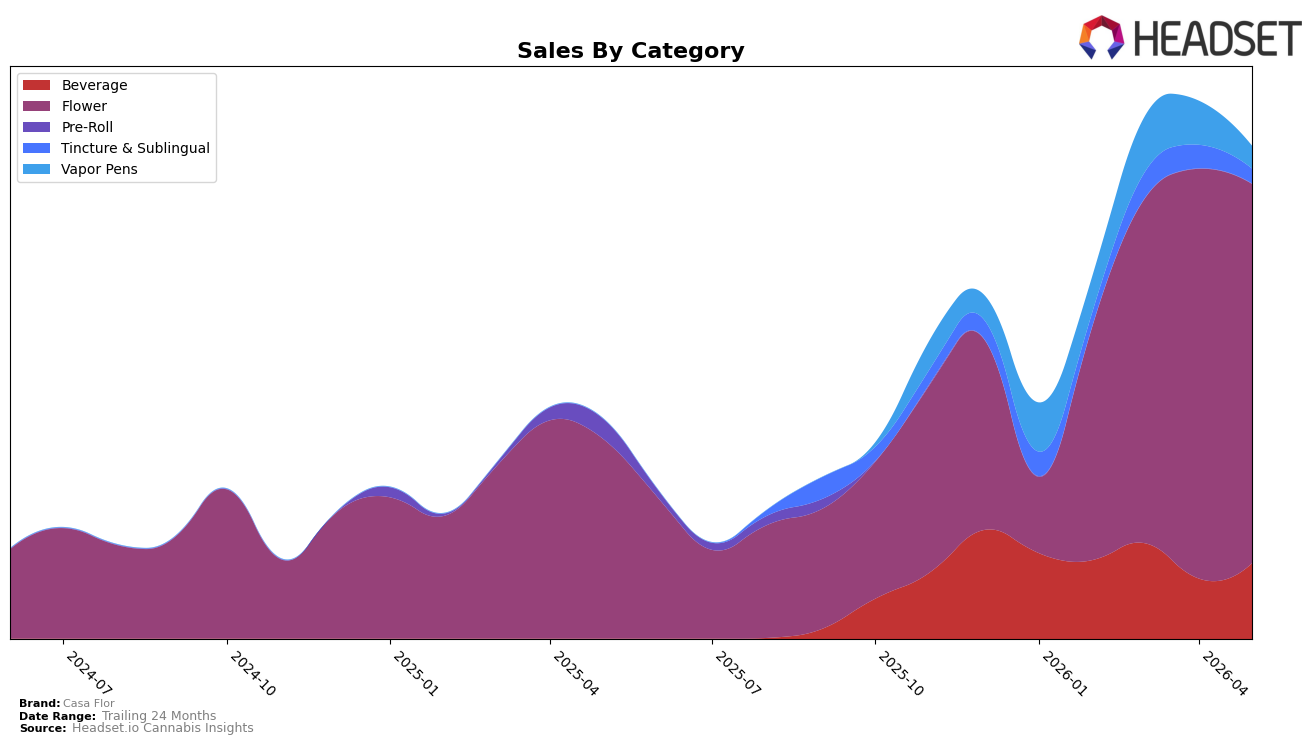
Casa Flor concentrated 77.12% of May 2026 sales in Flower, with year-over-year growth of 90.43% but a month-over-month decline of 7.42%, while Beverage held 15.33% share with a 25.41% month-over-month increase and Vapor Pens fell to 4.57% share on a 48.71% month-over-month drop. Tincture & Sublingual represented 2.97% share with a 37.17% month-over-month decline, and the average price rose 7.71% year over year to $19.84 as Flower average price sat at $19.16 versus Beverage at $22.05; the mix shift toward higher-priced Beverage alongside Flower contraction implies a deliberate rebalancing to support revenue efficiency despite category volatility.
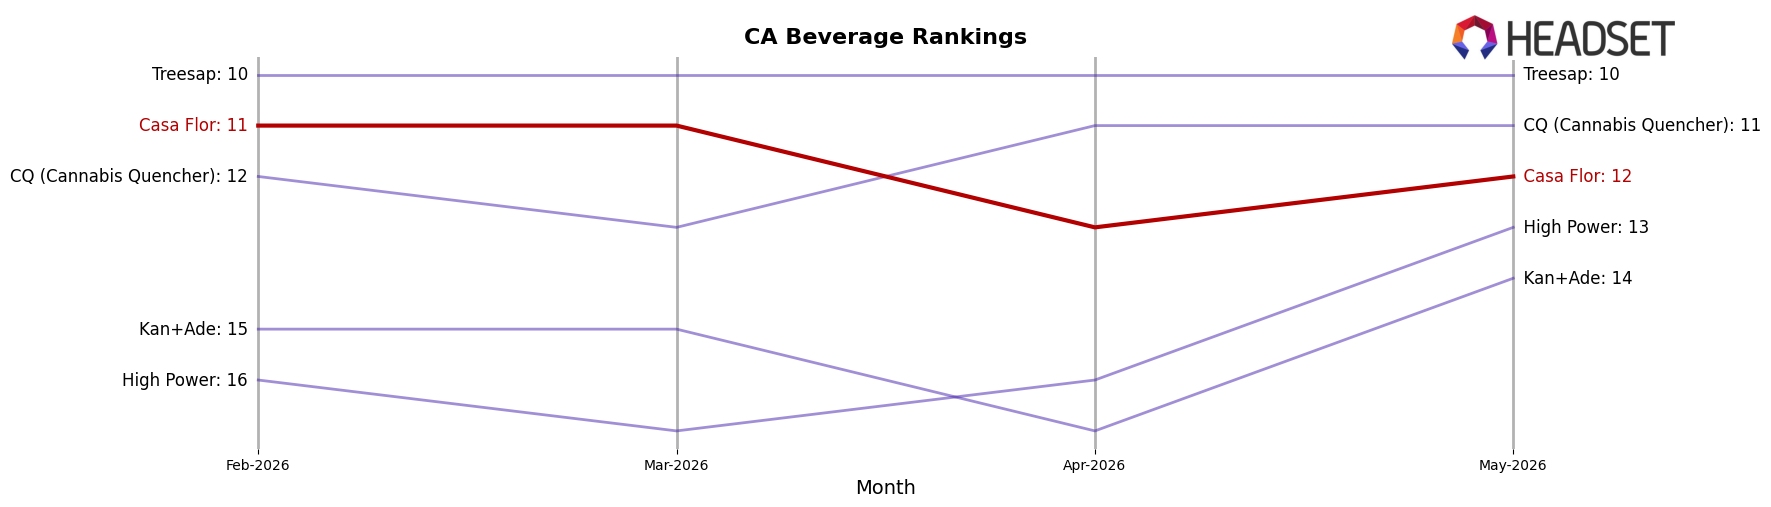
Within California Beverage, Casa Flor ranked 12 in May 2026 while Beverage’s internal share rose 10.76 percentage points versus Vapor Pens’ 4.57% footprint, indicating a pivot toward a category where price per unit is 15.06% above Flower and where month-over-month momentum was positive. With brand-level sales up 124.62% year over year and a 25.41% month-over-month Beverage lift offsetting a 7.42% Flower pullback, the portfolio is tilting toward fewer, higher-yielding units, which implies positioning the brand to capture mid-tier Beverage demand while using Flower scale as a volume floor.
Competitive Landscape
Casa Flor sits at #12 in CA Beverage in May 2026, down 1 spot from #11 in February 2026 and off its peak of #11 from March 2026, while category leaders moved differently: St Ides held #1 year over year with 1.7% sales growth and CANN Social Tonics improved its rank from #7 to #4 alongside a 30.4% YoY increase. Relative positioning shifted as Uncle Arnie's maintained #2 with 26.8% YoY growth and Not Your Father's Root Beer held #3 with 91.8% YoY growth, indicating Casa Flor’s slight slide of 1 rank over three months risks widening the gap against faster-rising competitors.
Notable Products
Durban Runtz Smalls (3.5g) posted the steepest movement in May 2026 with a -50.34% month-over-month drop and slid to rank 3, while Strawberry Dulce (3.5g) fell -25.86% at rank 2; in contrast, A.M.P.M. (3.5g) climbed +41.26% to rank 6 and Wedding Cake (3.5g) advanced +34.45% at rank 5. Five of the top ten are Flower SKUs, concentrated across both 3.5g and 14g formats, indicating share is consolidating in a few strains even as volatility widens within the eighth segment. The Watermelon Tamarindo Syrup Tincture (1000mg) rose +23.87% to rank 7 with $9,341 in sales, and Galleta Gas (3.5g) held rank 1 with a modest +5.94%, implying beverages are emerging as a stabilizer while flagship Flower carries volume. The pattern implies Casa Flor is shifting toward a barbell mix of a steady flagship and growing beverages offsetting sharp declines in select Flower SKUs, pointing to a near-term emphasis on format balance over strain proliferation.
Top Selling Cannabis Brands
Data for this report comes from real-time sales reporting by participating cannabis retailers via their point-of-sale systems, which are linked up with Headset’s business intelligence software. Headset’s data is very reliable, as it comes digitally direct from our partner retailers. However, the potential does exist for misreporting in the instance of duplicates, incorrectly classified products, inaccurate entry of products into point-of-sale systems, or even simple human error at the point of purchase. Thus, there is a slight margin of error to consider. Brands listed on this page are ranked in the top twenty within the market and product category by total retail sales volume.

