.svg)

Sep-2026
Sales
Trend
6-Month
Product Count
SKUs
Avg Price
YoY Sales Change
YoY Price Change


Where to Buy
CannaPunch is stocked at 70 licensed dispensaries across Colorado, with the deepest coverage in Denver, Pagosa Springs, Golden, Northglenn, and Aurora. Search by ZIP code or city below to find the closest one, or filter by product type if you are after a specific format.
Market Insights Snapshot
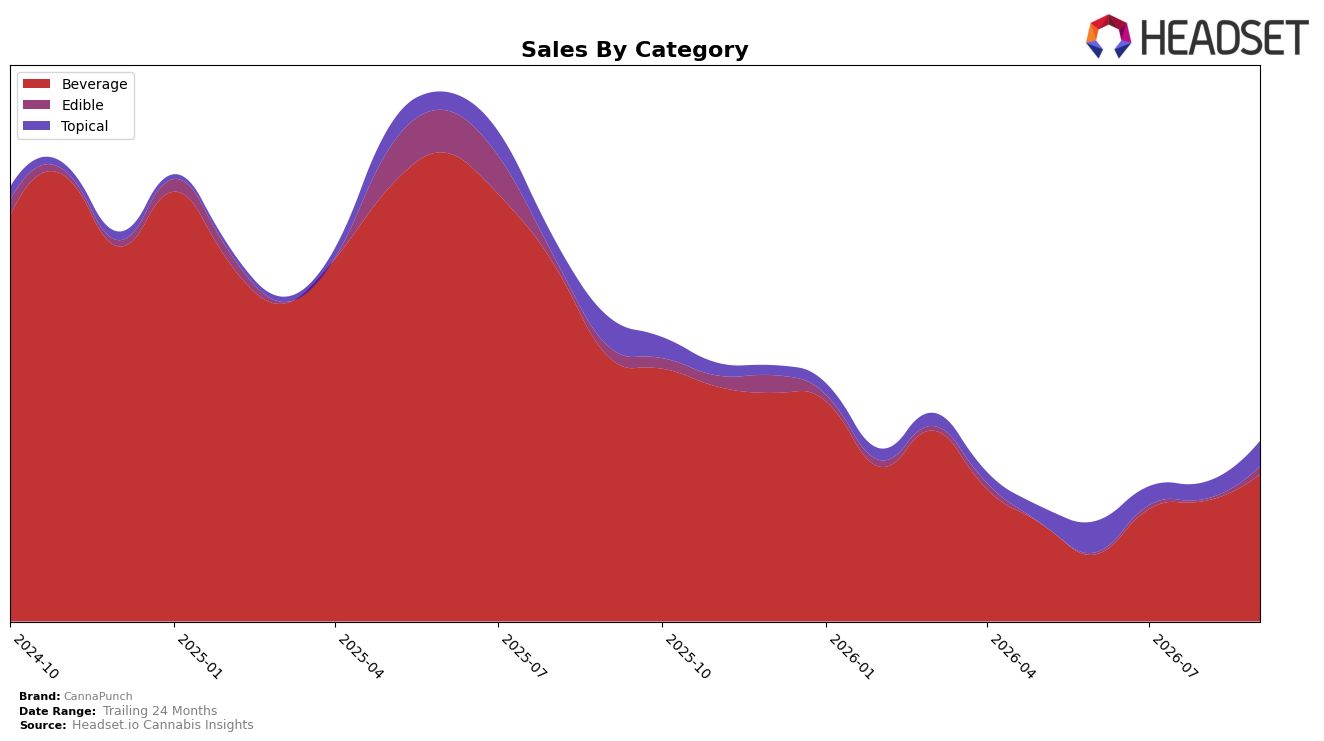
CannaPunch’s mix in September 2026 is concentrated in Beverage at 81.74% share with a month-over-month gain of 22.08% but a year-over-year decline of 44.57%, while Topical holds 13.84% share with a 49.81% MoM rise and a 15.06% YoY drop, and Edible sits at 4.42% share with a 420.83% MoM jump against a 20.74% YoY decline. Despite the brand’s overall sales falling 40.95% YoY and its average price rising 3.65% YoY to $15.79, Beverage pricing at $14.97 and Topical at $22.96 indicate a split between volume recovery and premium positioning; the pattern implies CannaPunch is relying on short-term MoM rebounds across all three categories to counter broad YoY contraction, anchoring revenue in Beverage while testing incremental lift from Topical and Edible.
With Beverage ranked 7 in Colorado and posting 81.74% mix alongside a 22.08% MoM uptick, the brand is positioned as a scale player in a single core lane while Topical’s 13.84% mix and 49.81% MoM surge, plus Edible’s 4.42% mix and 420.83% MoM spike, point to opportunistic adjacency bets rather than a structural pivot. Given the 61.91% 24-month sales decline and the category-level YoY drops of 44.57% in Beverage and 15.06% in Topical, the implication is that CannaPunch’s near-term share defense will depend on deepening Beverage velocity in Colorado while selectively scaling the faster MoM adjacencies to diversify revenue risk without diluting the core.
Competitive Landscape
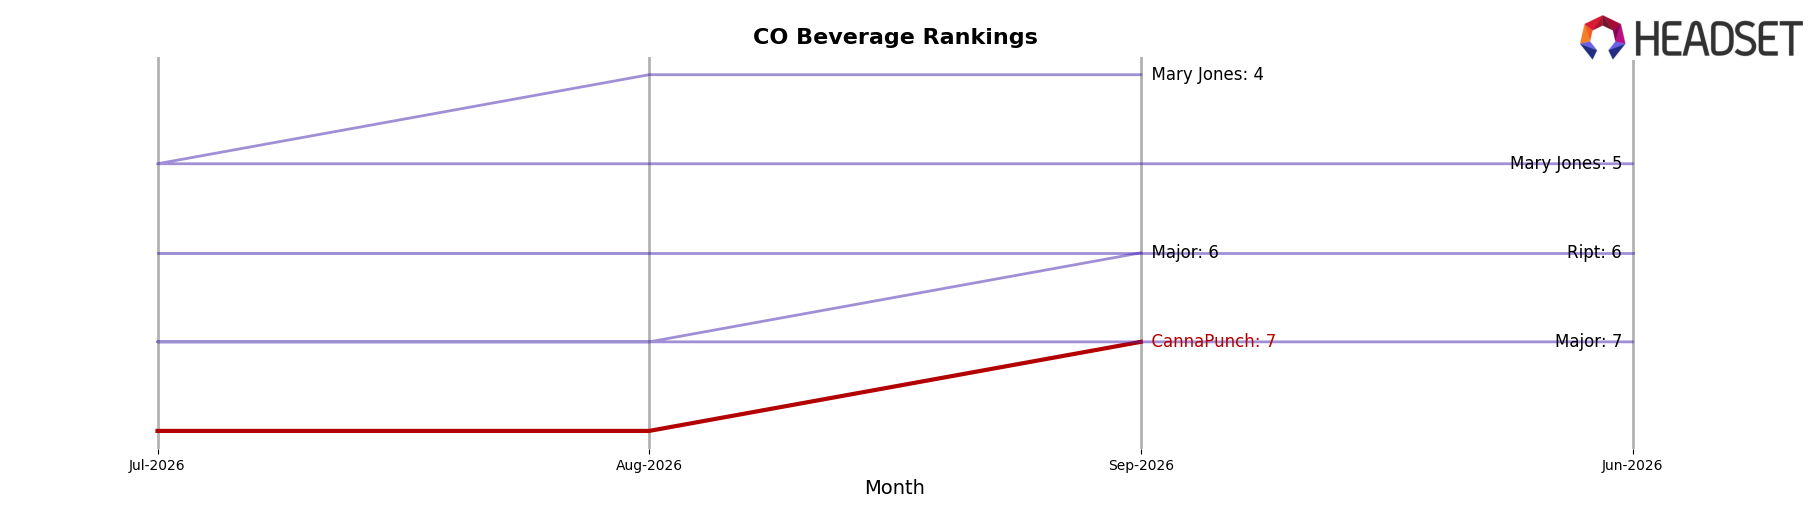
CannaPunch sits at rank #7 in CO Beverage for September 2026 after a year-over-year drop of 3 positions from #4, while its 3-month position improved 1 spot from #8 and its peak rank of #4 came in September 2025, indicating a retreat from prior momentum. Against competitors, Keef Cola holds #1 (flat YoY at #1) despite a 28.9% sales decline, and Ripple (formerly Stillwater Brands) is #3 (down 1 rank YoY from #2) with a 23.4% sales drop, suggesting the category’s leaders are contracting even as CannaPunch’s rank slid 3 places YoY. The combination of a 1-rank gain versus June 2026 and a 3-rank YoY decline implies CannaPunch is stabilizing quarter-on-quarter but losing relative footing over the year, a setup that points to share recapture potential if it can convert category-wide softness at the top into rank wins.
Notable Products
Blue Raspberry Punch Drink (100mg, 2oz, 59ml) delivered the standout move in September 2026 with a 401.7% month-over-month jump, vaulting into rank 7, while Grape Drink (100mg, 2oz, 59ml) fell 47.5% to rank 4, marking a sharp divergence within flavored beverages. Blue Raspberry Sour Punch Drink (100mg, 2oz, 59ml) also surged 143.3% to rank 3 as Pineapple Papaya Drink (100mg, 2oz, 59ml) rose 64.4% to rank 2, and with eight of the top ten products in Beverage, the portfolio is consolidating around drinkable formats at the expense of slower legacy SKUs. Strawberry Melon Punch Drink (100mg, 2oz, 59ml) held rank 1 with 36.5% growth and $5,817 in sales, while the CBD:THC 1:1 Wrangler Body Balm (250mg CBD, 250mg THC) climbed 49.8% to rank 5, indicating limited but growing traction outside beverages. The pattern implies CannaPunch is gaining velocity through flavor innovation in Beverage while pruning or de-emphasizing underperforming drink variants, using a small Topical foothold as diversification rather than a core growth driver.
Top Selling Cannabis Brands






Data for this report comes from real-time sales reporting by participating cannabis retailers via their point-of-sale systems, which are linked up with Headset’s business intelligence software. Headset’s data is very reliable, as it comes digitally direct from our partner retailers. However, the potential does exist for misreporting in the instance of duplicates, incorrectly classified products, inaccurate entry of products into point-of-sale systems, or even simple human error at the point of purchase. Thus, there is a slight margin of error to consider. Brands listed on this page are ranked in the top twenty within the market and product category by total retail sales volume.

