.svg)

Sep-2026
Sales
Trend
6-Month
Product Count
SKUs
Avg Price
YoY Sales Change
YoY Price Change


Where to Buy
Major is stocked at 613 licensed dispensaries across Washington, New York, and 8 other states, 209 of them in Washington, with the deepest coverage in Seattle, Spokane, Tacoma, Vancouver, and Olympia. Search by ZIP code or city below to find the closest one, or filter by product type if you are after a specific format.
Market Insights Snapshot
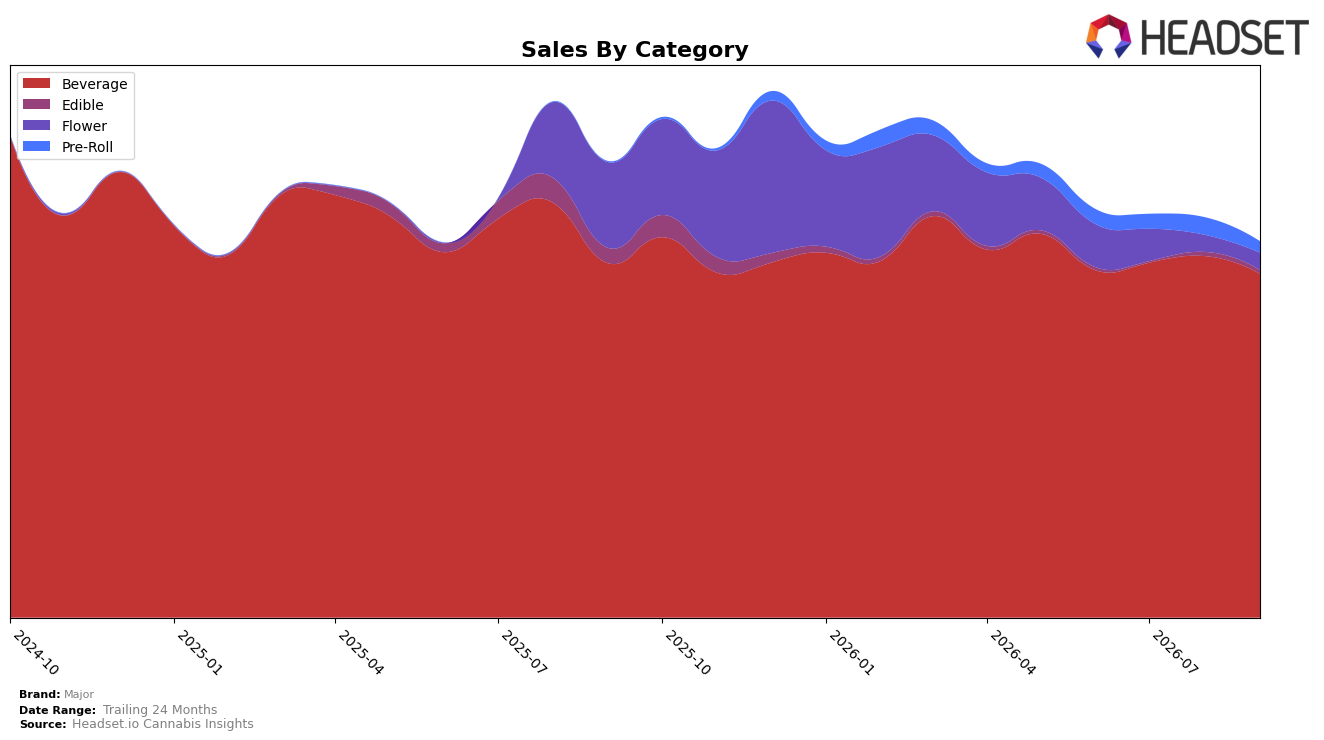
Major concentrated 91.66% of September 2026 sales in Beverage, where sales declined 2.97% year over year and 4.92% month over month, while the brand’s overall sales fell 17.62% year over year alongside a 20.38% drop in average price. Flower shrank to 4.51% share with an 80.19% year-over-year decline but inched up 1.32% month over month, whereas Pre-Roll surged 1,512.74% year over year to 2.93% share but contracted 36.09% month over month; Edible slipped to 0.90% share with a 77.47% year-over-year and 8.44% month-over-month decline. The pattern indicates a Beverage-led portfolio absorbing price compression and volume softness, with volatile but still small Pre-Roll gains unable to offset broad category pullbacks.
Holding the number 2 rank in Beverage in New Jersey while Beverage mix sits at 91.66% creates concentration risk if Beverage continues its 4.92% month-over-month slide and 2.97% year-over-year contraction, even as the brand’s average price fell 20.38% year over year. The 1,512.74% year-over-year lift in Pre-Roll juxtaposed with a 36.09% month-over-month decline and Flower’s 80.19% year-over-year drop suggest that short-term experiments outside Beverage remain low scale and choppy relative to the core. This positioning implies the near-term path depends on stabilizing Beverage velocity in priority markets like WA while selectively scaling Pre-Roll to diversify away from single-category exposure without diluting margin.
Competitive Landscape
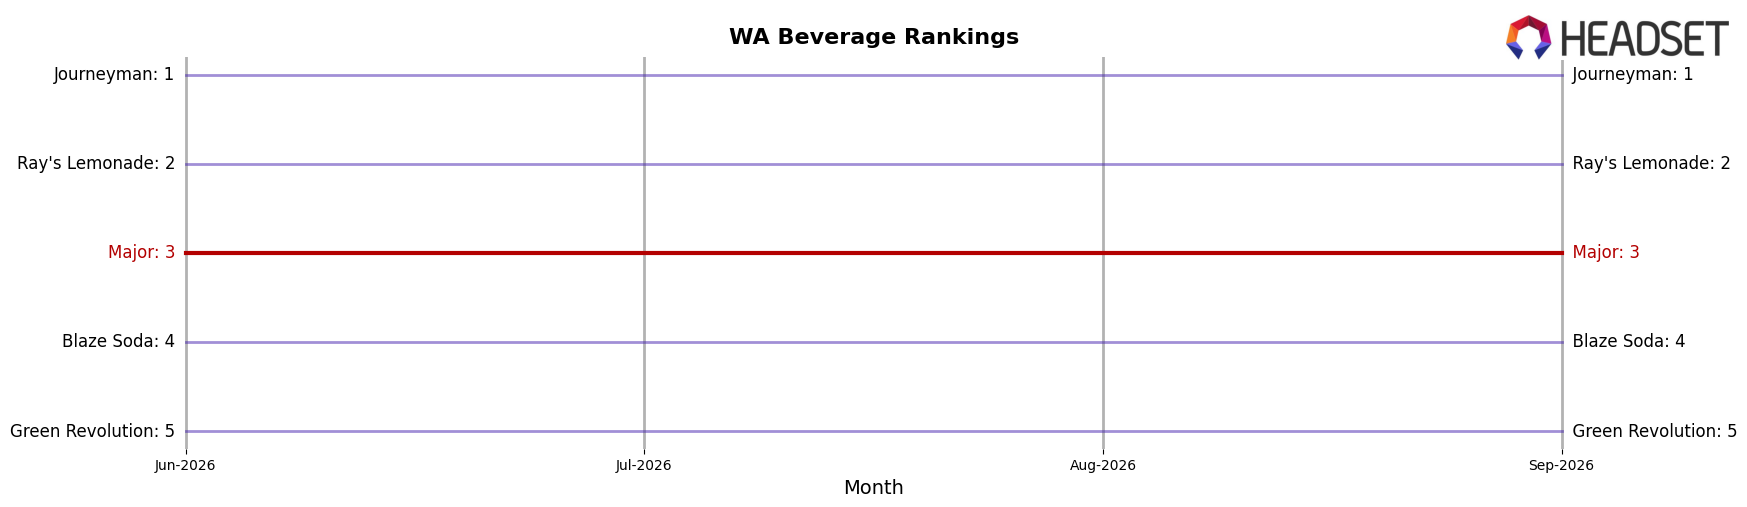
Major sits at #3 in WA Beverage in September 2026, unchanged from #3 year over year, with rank stability since June 2026 also at #3; this flat trajectory contrasts with Journeyman moving from #2 to #1 alongside a 36% year-over-year sales increase, while Ray's Lemonade slipped from #1 to #2 amid a 26.6% year-over-year decline, and Blaze Soda climbed from #7 to #4 with 96.8% year-over-year growth; the mix of upward and downward competitor mobility against Major’s steady #3 suggests a holding pattern where share is defended but future upside depends on displacing a weakening #2 or blocking a rapidly advancing #4.
Notable Products
The Original - Fruit Punch Blast Shot (100mg THC, 2oz) posted the steepest movement in September 2026 with a -23.5% month-over-month drop while holding rank 3, outpacing the -20.9% decline of Mojo-Rita Blast Shot (100mg THC, 2oz) at rank 10 and the -11.2% contraction for Blackberry Lemonade Blast Shot (100mg THC, 60ml, 2oz) at rank 1. In contrast, Pacific Coast Blue Raspberry Fruit Drink (100mg THC, 6.7oz) rose 14.3% at rank 8 as Volcanic Orange Mango Fruit Drink (100mg THC, 6.7oz) gained 5.4% at rank 6 and Apple Peach Blast Shot (100mg THC, 2oz) added 5.0% at rank 4. With all top-10 SKUs concentrated in Beverage and five of the top five positions held by 2oz Blast Shot formats, the mix implies a pivot risk: reliance on short-format shots is pressuring the leaderboard when flagship shots decline, nudging portfolio momentum toward 6.7oz fruit drinks.
Top Selling Cannabis Brands






Data for this report comes from real-time sales reporting by participating cannabis retailers via their point-of-sale systems, which are linked up with Headset’s business intelligence software. Headset’s data is very reliable, as it comes digitally direct from our partner retailers. However, the potential does exist for misreporting in the instance of duplicates, incorrectly classified products, inaccurate entry of products into point-of-sale systems, or even simple human error at the point of purchase. Thus, there is a slight margin of error to consider. Brands listed on this page are ranked in the top twenty within the market and product category by total retail sales volume.

