Market Insights Snapshot
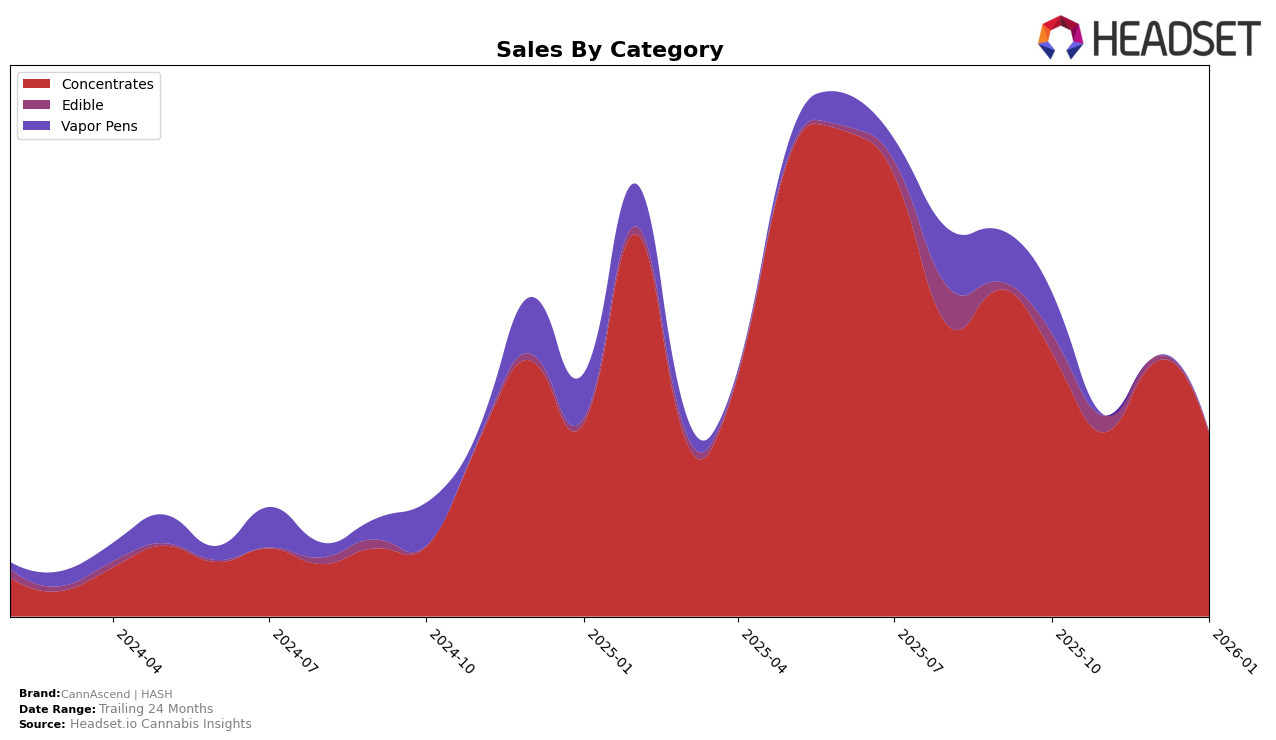
In the Ohio market, CannAscend | HASH has shown fluctuations in its ranking within the Concentrates category over the observed months. Starting at a rank of 20 in October 2025, the brand experienced a slight dip to 22 in November, then climbed back to 19 in December before returning to 22 in January 2026. This movement suggests a competitive landscape where CannAscend | HASH is maintaining a presence but facing challenges in consistently climbing the ranks. The brand's sales figures also reflect this volatility, with a notable peak in December, indicating potential seasonal demand or successful promotional efforts during that period.
It's noteworthy that CannAscend | HASH has managed to remain within the top 30 brands in Ohio's Concentrates category, despite the competitive pressures. However, maintaining a steady position or improving their rank could be crucial for long-term success. The absence of CannAscend | HASH in the top 30 in any other states or categories suggests that their current market focus is heavily concentrated in Ohio. This could be a strategic decision or a limitation that the brand might need to address to expand its market presence and capitalize on opportunities in other regions or product categories.
Competitive Landscape
In the competitive landscape of the Ohio concentrates market, CannAscend | HASH has shown a fluctuating performance in recent months, with its rank oscillating between 19th and 22nd place from October 2025 to January 2026. This variability in rank suggests a dynamic market environment where CannAscend | HASH faces stiff competition from brands like Ancient Roots, which consistently outperformed CannAscend | HASH by maintaining a higher rank, peaking at 18th in January 2026. Meanwhile, Lighthouse Sciences experienced a significant drop from 9th to 26th place, indicating potential market volatility that CannAscend | HASH could capitalize on. Despite these challenges, CannAscend | HASH's sales figures reveal a resilient brand with a notable rebound in December 2025, although sales dipped again in January 2026. This suggests that while CannAscend | HASH is holding its ground, there is room for strategic improvements to enhance its market position against competitors like HZ, which showed a positive trend by climbing to 19th place in January 2026.

Notable Products
In January 2026, Thai Kush Rosin Badder (1g) emerged as the top-performing product for CannAscend | HASH, climbing to the number one rank with a notable sales figure of 231 units. Thai Kush Rosin (1g) also showed impressive performance, advancing from fourth to second place with a significant increase in sales compared to the previous month. Chimera Truffle Live Rosin Badder (1g) maintained a steady presence, holding the third position after previously ranking first in November 2025. Frosted Enigma Live Rosin Badder (1g) entered the rankings for the first time in January, securing the third spot. Watermelon Kiwi Fruit Bites 10-Pack (100mg) experienced a drop, moving from second place in November to fourth in January, indicating a shift in consumer preference towards concentrates.
Top Selling Cannabis Brands
Data for this report comes from real-time sales reporting by participating cannabis retailers via their point-of-sale systems, which are linked up with Headset’s business intelligence software. Headset’s data is very reliable, as it comes digitally direct from our partner retailers. However, the potential does exist for misreporting in the instance of duplicates, incorrectly classified products, inaccurate entry of products into point-of-sale systems, or even simple human error at the point of purchase. Thus, there is a slight margin of error to consider. Brands listed on this page are ranked in the top twenty within the market and product category by total retail sales volume.

