Jun-2026
Sales
Trend
6-Month
Product Count
SKUs
Avg Price
YoY Sales Change
YoY Price Change
Market Insights Snapshot
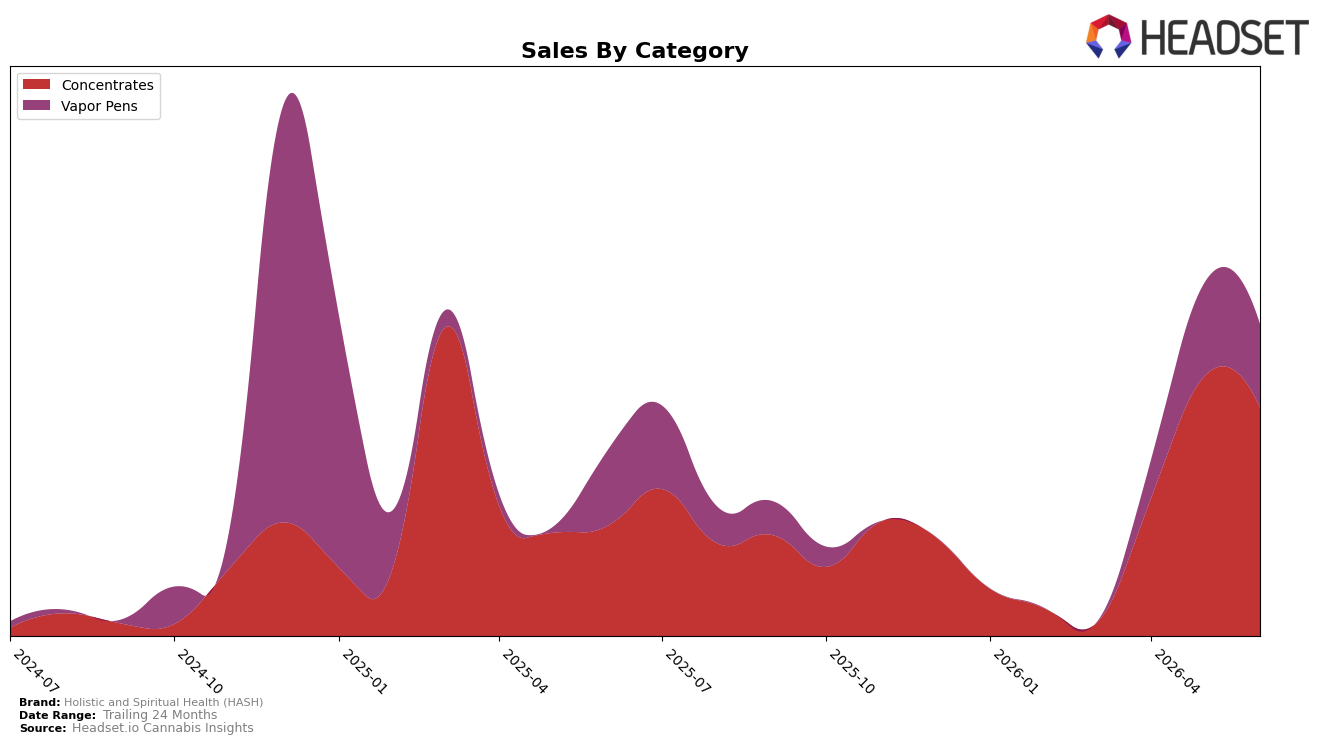
Holistic and Spiritual Health (HASH) concentrated 73.25% of June 2026 sales in Concentrates with a 26.75% balance in Vapor Pens, while Concentrates grew 106.70% year over year but fell 12.16% month over month and Vapor Pens rose 10.05% year over year but declined 10.56% month over month. With average price down 10.32% year over year to $38.12 and category price points near parity (Concentrates at $38.25 vs Vapor Pens at $37.75), the mix shift is quantity-led within Concentrates rather than price-led, and the dual MoM declines indicate a June pullback tied more to overall demand timing than to intra-portfolio cannibalization.
Given a 19th rank in Concentrates in Ohio and Concentrates carrying 73.25% share alongside 106.70% year-over-year growth, the brand’s positioning leans into a depth strategy in a single category rather than diversification, which concentrates competitive risk on one shelf segment while keeping price alignment tight. The comparatively modest 10.05% year-over-year increase in Vapor Pens versus 106.70% in Concentrates, coupled with similar price levels and a 10.56% month-over-month dip for Vapor Pens against a 12.16% dip for Concentrates, implies the brand is not using Vapor Pens as a countercyclical buffer, so the portfolio will track Concentrates seasonality and promotional cycles more than cross-category hedging.
Competitive Landscape
Holistic and Spiritual Health (HASH) sits at rank 19 in OH Concentrates in June 2026, improving 5 positions year over year from rank 24 while rebounding 24 spots versus its March 2026 position at rank 43; despite that climb, it remains 6 places below its category peak at rank 13 from March 2025. Competitive pressure is concentrated at the top where Klutch Cannabis held rank 1 both year over year and in June 2026, and Hundred Percent Labs advanced from rank 7 to rank 3 alongside a 129.7% YoY sales increase, indicating faster share consolidation ahead of mid-tier brands; this juxtaposition of a mid-pack rise (rank 24 to 19) against top-tier stability and acceleration implies HASH’s trajectory is recovery-driven but capped by accelerating leaders unless distribution or product mix shifts materially.

Notable Products
Chikitaz x Cake Crasher Live Resin Sugar (1g) delivered the most abrupt movement in June 2026 with a -65.5% month-over-month slide to rank 8, while Multi-Strain Live Resin Badder (1g) also contracted by -38.6% yet held rank 4. In contrast, Heavy Pulp Badder (1g) climbed 88.5% month over month to rank 7, and Heavy Pulp Live Resin Badder (1g) rose 15.6% while holding the top rank and generating $20,219. With six of the top ten SKUs concentrated in Concentrates and two of those moving more than +80% or below -60%, the product set is tilting toward volatility at the tails rather than steady mid-pack growth, implying HASH is leaning into a concentrate-heavy portfolio where hero SKUs carry disproportionate momentum and risk.
Top Selling Cannabis Brands
Data for this report comes from real-time sales reporting by participating cannabis retailers via their point-of-sale systems, which are linked up with Headset’s business intelligence software. Headset’s data is very reliable, as it comes digitally direct from our partner retailers. However, the potential does exist for misreporting in the instance of duplicates, incorrectly classified products, inaccurate entry of products into point-of-sale systems, or even simple human error at the point of purchase. Thus, there is a slight margin of error to consider. Brands listed on this page are ranked in the top twenty within the market and product category by total retail sales volume.

