Jun-2026
Sales
Trend
6-Month
Product Count
SKUs
Avg Price
YoY Sales Change
YoY Price Change
Market Insights Snapshot
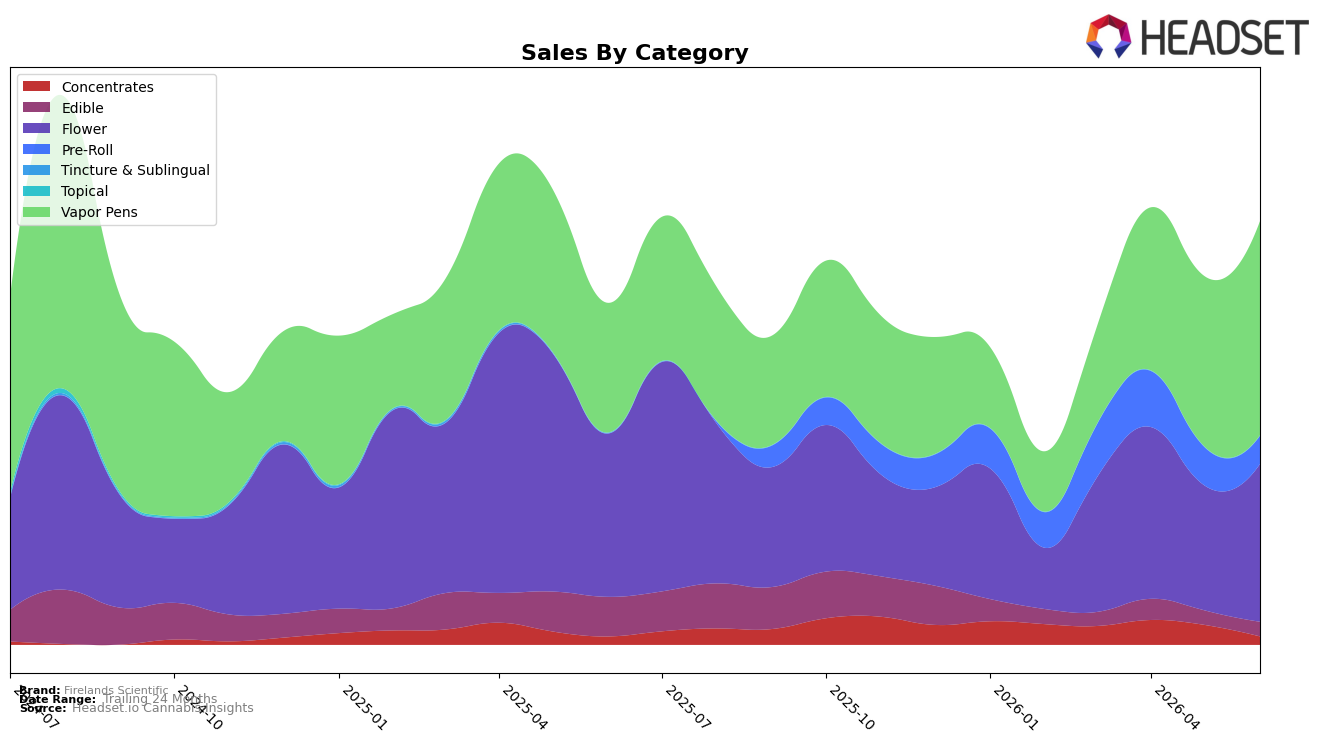
In June 2026, Vapor Pens expanded to 50.70% share with 65.40% year-over-year growth and a 25.66% month-over-month lift, while holding an average price of $26.90; in contrast, Flower held 37.34% share with a -3.38% year-over-year decline despite a 26.49% month-over-month bump and an average price of $50.38. Pre-Roll contracted to 6.61% share with a -26.74% month-over-month change and no year-over-year figure, and Edible slid to 3.41% share with -63.40% year-over-year and a 0.79% month-over-month uptick; Concentrates were 1.95% share with flat 0.05% year-over-year but a -58.33% month-over-month swing. Coupled with a -26.38% year-over-year drop in average price across the brand and 24.05% year-over-year brand sales growth, the pattern implies Firelands Scientific is concentrating volume into lower-priced inhalables led by Vapor Pens, reducing dependence on Flower and shrinking exposure to Edible and Concentrates in Ohio.
With Vapor Pens leading category mix at 50.70% and a category rank of 12 in Ohio Vapor Pens, the 25.66% month-over-month and 65.40% year-over-year growth signal a pivot toward scalable, price-accessible inhalables while Flower’s -3.38% year-over-year and 26.49% month-over-month recovery indicate tactical stabilization rather than long-term expansion. The steep -26.74% month-over-month drop in Pre-Roll alongside a -58.33% month-over-month contraction in Concentrates, combined with Edible’s -63.40% year-over-year, suggest pruning of peripheral categories to fund price moves that lifted total brand sales 24.05% year-over-year despite a -26.38% average price shift. This mix and pricing posture imply Firelands Scientific is positioning to climb toward top-10 relevance in Ohio Vapor Pens while using Flower primarily as a volume stabilizer rather than a share-growth engine.
Competitive Landscape
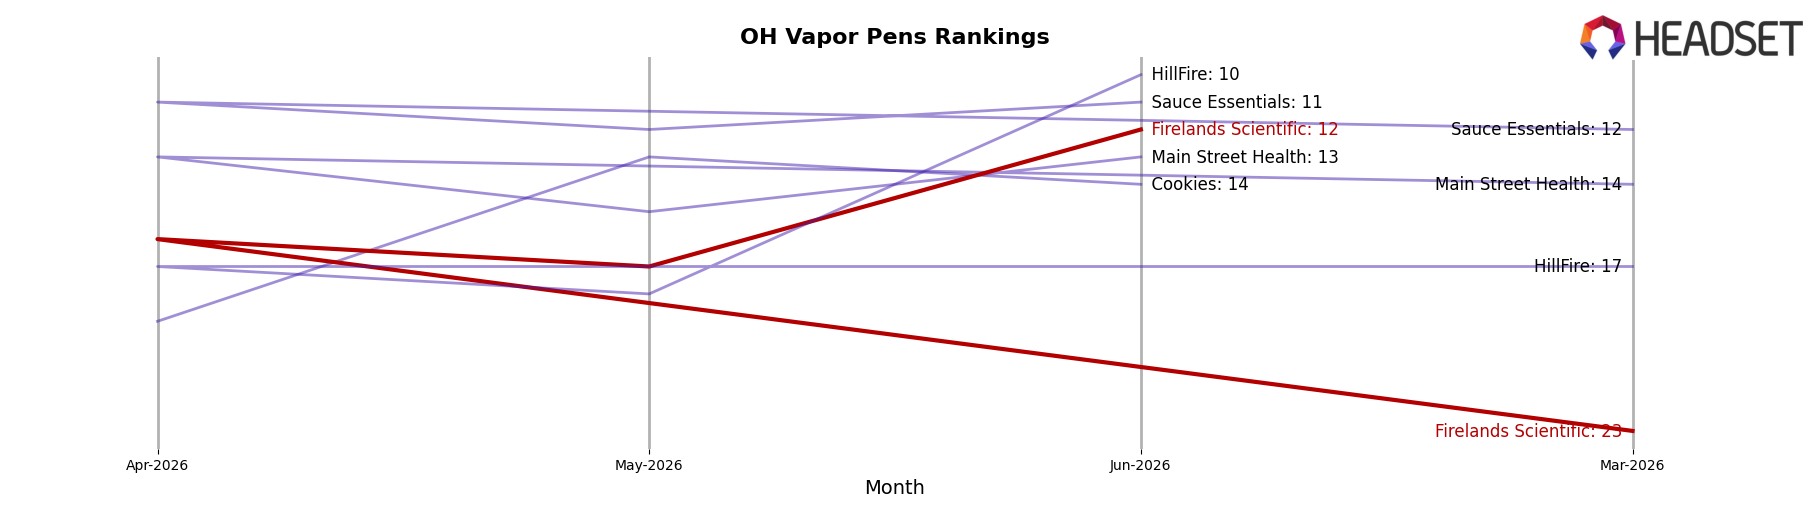
Firelands Scientific sits at rank #12 in OH Vapor Pens in June 2026, a 3-place YoY rise from #15, and a 11-position climb since March 2026 when it was #23; meanwhile, its historic peak was #6 in July 2024, placing the current slot 6 ranks below that high-water mark. Among leaders, Certified (Certified Cultivators) held #1 both YoY and in June 2026 while growing sales 30.9%, and Rove advanced from #10 to #5 alongside a 98.5% sales increase, outpacing Firelands Scientific’s rank momentum relative to its 3-month jump from #23 to #12; Select also inched up from #5 to #4 with 24.1% growth, signaling that movement within the top 5 is tightening faster than mid-pack shifts. The pattern implies that Firelands Scientific’s recent ascent is recovery from a mid-tier trough rather than a return to its July 2024 ceiling, and sustaining the climb will require converting mid-pack gains into top-10 penetration where rivals are accelerating ranks more quickly.
Notable Products
Hella Jelly CO2 Cartridge (1g) posted the largest movement in June 2026 with an 87.8% month-over-month surge, jumping into rank 2 while the category’s next closest vapor pen sits lower at rank 5, implying a discrete win rather than a tide lifting all boats. Super Silver Pupil Pre-Roll (1g) held rank 1 as GP-20 Pre-Roll (1g) trailed at rank 4, and with Lab Leak Pre-Roll (1g) inching only 2.4% MoM at rank 8, Pre-Roll leadership is concentrated but not expanding. Vapor Pens occupy three of the top seven while Flower claims two spots in the top ten including Starbux Smalls (14.15g) at rank 9, indicating cross-category balance even as one vapor SKU accelerates. The mix signals a pivot toward higher-velocity inhalables anchored by a breakout vapor pen, suggesting Firelands Scientific is prioritizing cartridge-driven share while maintaining a stable Pre-Roll anchor.
Top Selling Cannabis Brands
Data for this report comes from real-time sales reporting by participating cannabis retailers via their point-of-sale systems, which are linked up with Headset’s business intelligence software. Headset’s data is very reliable, as it comes digitally direct from our partner retailers. However, the potential does exist for misreporting in the instance of duplicates, incorrectly classified products, inaccurate entry of products into point-of-sale systems, or even simple human error at the point of purchase. Thus, there is a slight margin of error to consider. Brands listed on this page are ranked in the top twenty within the market and product category by total retail sales volume.

