.svg)

Sep-2026
Sales
Trend
6-Month
Product Count
SKUs
Avg Price
YoY Sales Change
YoY Price Change


Where to Buy
Captain Yeti is stocked at 73 licensed dispensaries across Washington, with the deepest coverage in Seattle, Tacoma, Spokane, Vancouver, and Anacortes. Search by ZIP code or city below to find the closest one, or filter by product type if you are after a specific format.
Market Insights Snapshot
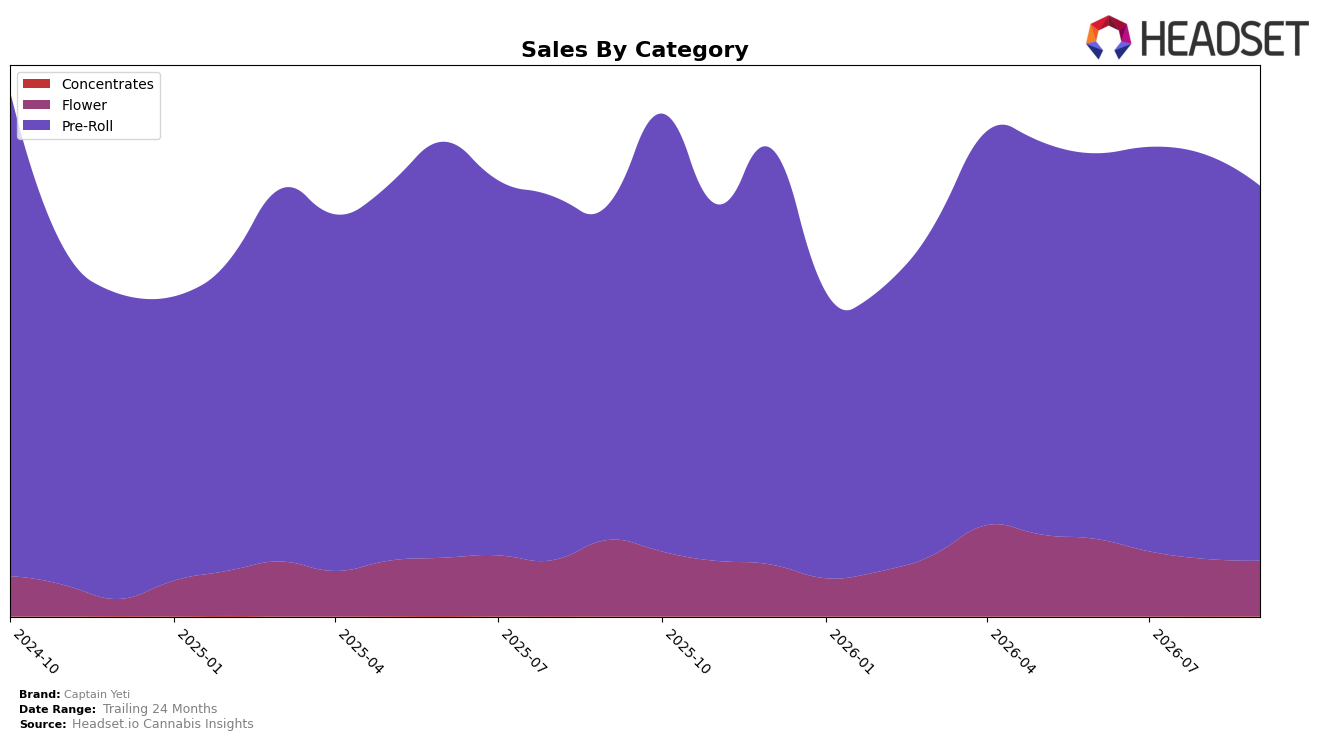
Captain Yeti concentrated 87.16% of September 2026 sales in Pre-Roll, up 11.80% year over year but down 7.30% month over month, while Flower held 12.84% share with a 27.34% YoY decline and a 2.99% MoM dip. The brand’s average price fell 8.81% YoY to $7.92 as overall brand sales rose 4.57% YoY, and within Pre-Roll the category rank in Washington was 13th, indicating scale but not top-decile placement. The mix shift implies Captain Yeti is deepening reliance on Pre-Roll for growth while absorbing near-term volume softness, and the simultaneous price compression alongside positive YoY sales points to elastic demand concentrated in a single category.
With Pre-Roll at 87.16% share and 11.80% YoY growth offsetting a 27.34% YoY contraction in Flower, the brand’s exposure skews toward a price-sensitive engine where a 7.30% MoM pullback can materially sway total performance. Holding 13th rank in Washington Pre-Roll amid an 8.81% YoY price decline suggests a tactical trade-off: price-led competitiveness sustaining share despite category concentration, while the Flower contraction and 2.99% MoM decline limit diversification. This pattern implies positioning as a value-forward Pre-Roll specialist where incremental gains will likely come from tightening MoM volatility and selectively rebuilding Flower to reduce single-category risk.
Competitive Landscape
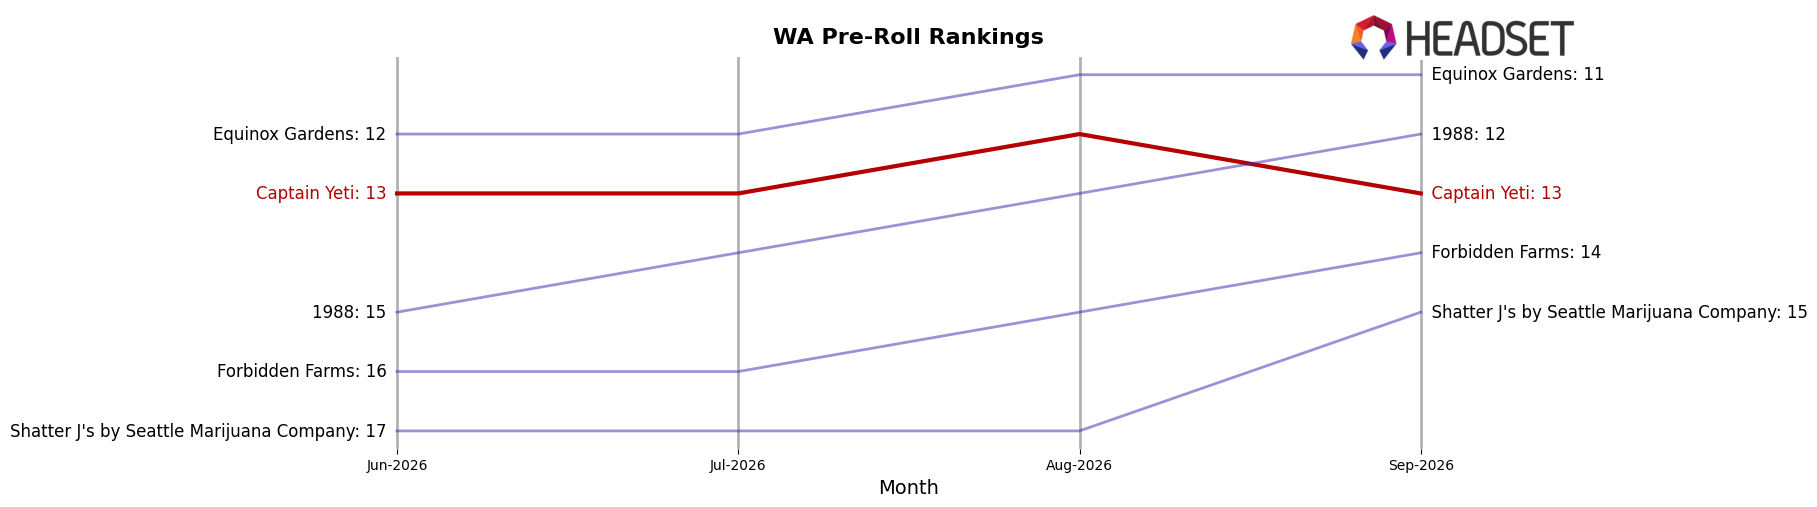
Captain Yeti sits at rank #13 in WA Pre-Roll for September 2026, a 2-position improvement from rank #15 in September 2025, while holding flat quarter-over-quarter at #13 and coming off a peak of #12 in August 2026; in contrast, Ooowee held #1 year over year and in September 2026, and Lifted Cannabis Co climbed from #5 to #4 as Stingers slipped from #4 to #5. With leaders maintaining or gaining positions at the top and Captain Yeti improving only 2 ranks year over year while failing to convert an August 2026 #12 into further gains, the pattern implies a stabilization in the low-teens that will require share-capture tactics to break into the top 10.
Notable Products
Fuck Around and Find Out Infused Pre-Roll (1g) led the movement in September 2026 with a -21.3% month-over-month drop while holding rank 1, and Pure Fucking Magic Hash Infused Pre-Roll (1g) also contracted at -14.9% from rank 5, signaling price or velocity pressure at the top and mid-pack. Bitch Don't Kill My Vibe Hash Infused Pre-Roll (1g) fell -11.8% at rank 6, whereas Fuck Around and Find Out Hash Infused Pre-Roll 3-Pack (1.5g) at rank 2 limited decline to -8.0%, indicating multi-pack resilience relative to single sticks. With eight of the top ten as Hash Infused Pre-Roll SKUs and Ray of Fucking Sunshine Hash Infused Pre-Roll 3-Pack (1.5g) sliding -13.0% at rank 7, the assortment is concentrated in one form factor, implying Captain Yeti is leaning into infused pre-roll dominance but must rebalance pack architecture and strain mix to stabilize month-over-month volatility.
Top Selling Cannabis Brands






Data for this report comes from real-time sales reporting by participating cannabis retailers via their point-of-sale systems, which are linked up with Headset’s business intelligence software. Headset’s data is very reliable, as it comes digitally direct from our partner retailers. However, the potential does exist for misreporting in the instance of duplicates, incorrectly classified products, inaccurate entry of products into point-of-sale systems, or even simple human error at the point of purchase. Thus, there is a slight margin of error to consider. Brands listed on this page are ranked in the top twenty within the market and product category by total retail sales volume.

