Jun-2026
Sales
Trend
6-Month
Product Count
SKUs
Avg Price
YoY Sales Change
YoY Price Change
Market Insights Snapshot
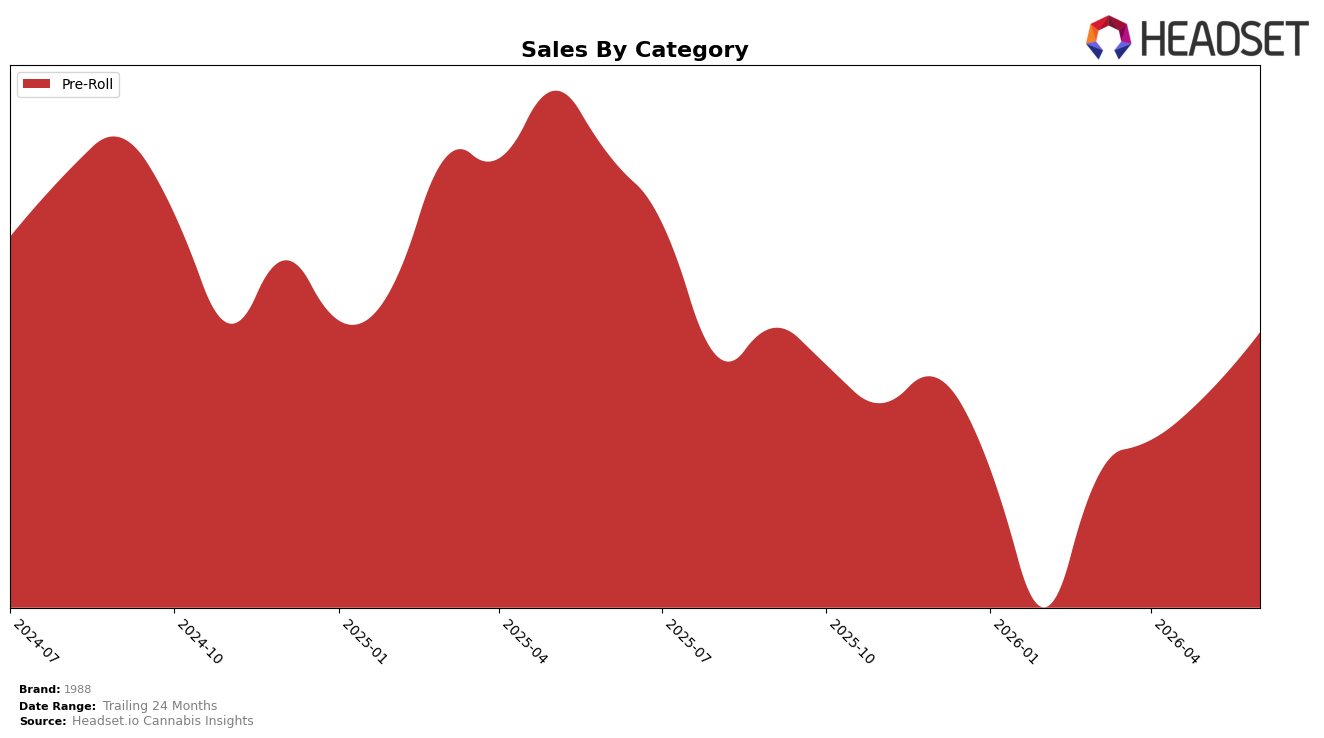
In June 2026, 1988’s mix is entirely concentrated in Pre-Roll at 100.0% share, with category sales down 19.78% year over year but up 9.74% month over month, while average price fell 14.72% YoY alongside the MoM lift. Within Washington Pre-Roll, the brand sits at rank 15, and the combination of a single-category footprint and a positive MoM swing indicates the recent month’s volume recovery is price-led rather than mix-driven, implying elasticity gains within Pre-Roll despite the annual contraction.
The pivot implied by a 100.0% Pre-Roll mix and a rank of 15 in Washington suggests 1988 is competing on accessible price points to recapture velocity after a 19.78% YoY decline, with the 9.74% MoM growth aligning to price elasticity rather than assortment breadth. This pattern implies that sustaining share at a mid-pack position will likely depend on maintaining the 14.72% YoY price compression while selectively enhancing Pre-Roll differentiation, as category concentration leaves limited buffer against further rank slippage within the same competitive tier.
Competitive Landscape
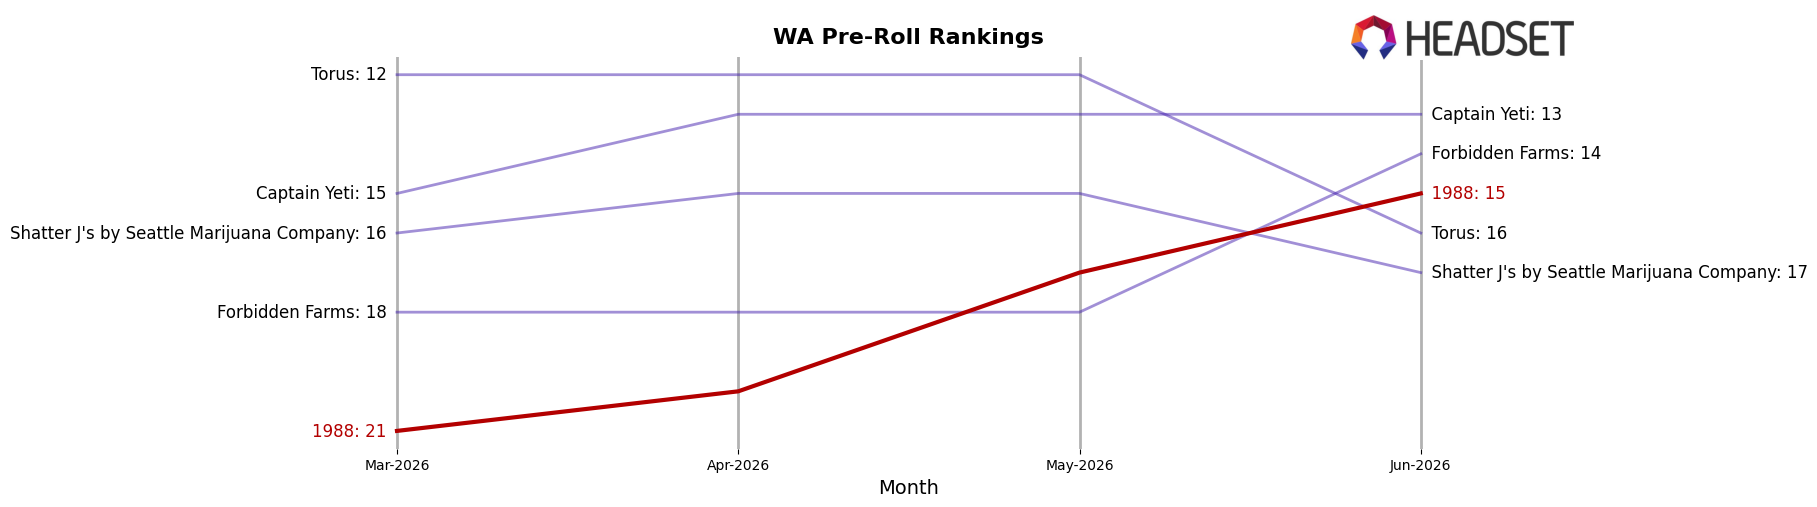
1988 sits at rank #15 in WA Pre-Roll in June 2026 after a year-over-year climb of 1 position from #16 to #15, and it improved 6 ranks versus March 2026 by moving from #21 to #15; the current rank also matches its peak at #15 in June 2026. In contrast, Ooowee rose from #2 to #1 while growing sales by 68.9%, and Phat Panda slipped from #1 to #2 with 1.8% sales growth, indicating that 1988’s modest rank gain of 1 position year over year and faster 3-month jump of 6 positions point to momentum concentrated in recent months rather than across the full year; taken together, the trajectory implies 1988 is stabilizing at the edge of the top 15 with near-term upside dependent on sustaining the recent quarter’s pace against leaders consolidating share.
Notable Products
Blueberry Infused Blunt (1g) posted the largest month-over-month surge at +75.7% and climbed to rank 2, while Honey Infused Blunt (1g) advanced with a +68.0% rise to rank 3; Ice Cream Cookies Infused Blunt (1g) also cleared the +50% mark at +57.7% while settling at rank 6. With African Mango Infused Blunt (1g) holding rank 1 on a smaller +8.4% lift and four other top-10 SKUs adding gains between +5.9% and +70.0%, the stack shows acceleration concentrated below the top spot. Eight of the top ten are Pre-Roll SKUs from the same infused blunt family, indicating a tightly clustered lineup where mid-pack products are expanding faster than the flagship. This pattern implies 1988 is shifting commercial momentum toward breadth within flavored infused Pre-Rolls rather than relying on a single lead SKU, suggesting mix-led growth and room to trade customers into higher-velocity variants even as the category leader stays stable.
Top Selling Cannabis Brands
Data for this report comes from real-time sales reporting by participating cannabis retailers via their point-of-sale systems, which are linked up with Headset’s business intelligence software. Headset’s data is very reliable, as it comes digitally direct from our partner retailers. However, the potential does exist for misreporting in the instance of duplicates, incorrectly classified products, inaccurate entry of products into point-of-sale systems, or even simple human error at the point of purchase. Thus, there is a slight margin of error to consider. Brands listed on this page are ranked in the top twenty within the market and product category by total retail sales volume.

