.svg)
Sep-2026
Sales
Trend
6-Month
Product Count
SKUs
Avg Price
YoY Sales Change
YoY Price Change


Market Insights Snapshot
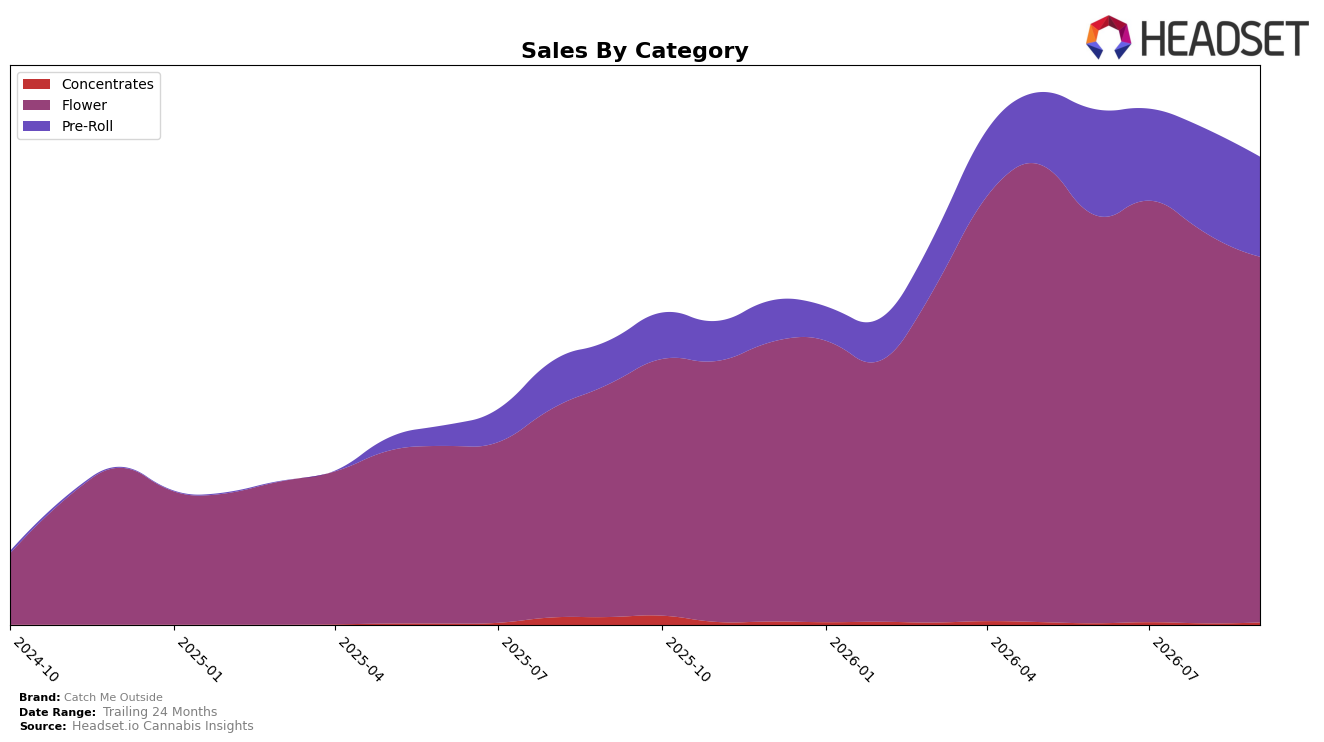
Catch Me Outside’s mix in September 2026 is concentrated in Flower at 78.18% share (ranked 20 in Flower within Alberta), with Pre-Roll at 21.32% and Concentrates at 0.50%. Year over year, Flower grew 57.28% while Pre-Roll surged 130.53%, but month over month both Flower declined 6.46% and Pre-Roll fell 4.01%; in contrast, Concentrates rebounded 64.97% MoM despite a -69.86% YoY drop. The mix implies a reliance on Flower that is gaining on a yearly basis but retrenching monthly, while an accelerating YoY tilt toward Pre-Roll is constrained by short-term pullback, signaling a portfolio leaning into two combustion formats with uneven near-term momentum.
With overall brand sales up 65.00% YoY and average price up 16.38%, the combination of a 57.28% YoY lift in Flower and a 130.53% YoY lift in Pre-Roll suggests pricing power and velocity are carrying core formats even as MoM softness (-6.46% in Flower, -4.01% in Pre-Roll) introduces volatility. Holding the 20 rank in Flower in Alberta while Pre-Roll gains mix share to 21.32% indicates mid-pack Flower positioning with an expanding secondary pillar; the spike of 64.97% MoM in Concentrates from a 0.50% base implies test-and-learn activity rather than a scale push.
Competitive Landscape
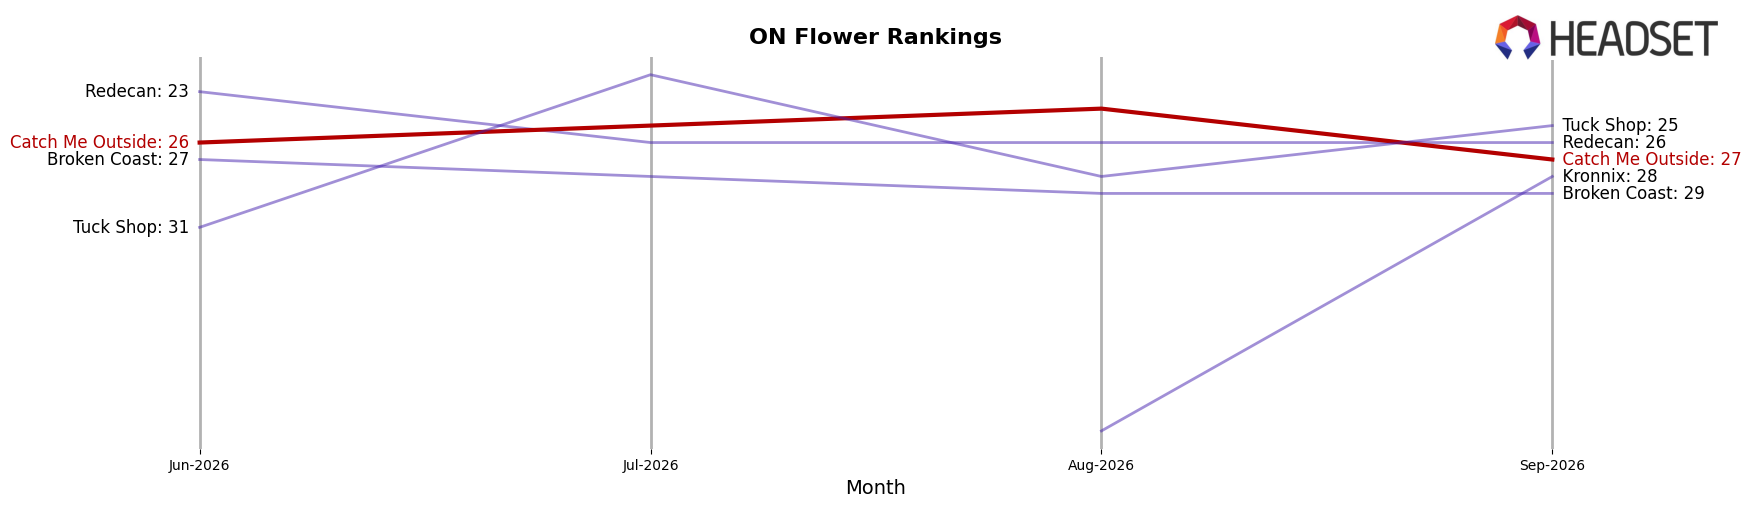
Catch Me Outside sits at rank #27 in ON Flower for September 2026, improving 6 positions year over year from #33, but slipping 1 spot from June 2026’s #26 and 3 from its August 2026 peak at #24; in contrast, Spinach moved from #3 to #1 with 15.7% YoY sales growth while Back Forty / Back 40 Cannabis slid from #1 to #3 with a 7.4% YoY decline, indicating Catch Me Outside’s mid-pack gains are occurring alongside leadership consolidation at the top and churn just below it, which implies the brand’s upward YoY trajectory is real but fragile without sustained share capture from ranks #20–#25.
Notable Products
Rooster Call (3.5g) posted the steepest decline at -16.8% month over month while holding rank 3, and Couch Potato Pre-Roll 4-Pack (4g) fell -11.6% at rank 4, signaling pressure on both a flagship eighth and a key multipack. In contrast, Rooster Call Pre-Roll 20-Pack (10g) rose +21.3% at rank 8 and Rooster Call (14g) gained +15.3% at rank 6, while Farmer's Market (28g) slipped -9.6% at rank 5 off a single-month base of $243,145. With seven of the top ten in Flower and two of the top four in Pre-Roll multipacks, the mix points to shifting demand from core 3.5g SKUs toward larger Flower sizes and value-oriented Pre-Rolls, implying a pivot toward pack-size value over single-eighth velocity in September 2026.
Top Selling Cannabis Brands






Data for this report comes from real-time sales reporting by participating cannabis retailers via their point-of-sale systems, which are linked up with Headset’s business intelligence software. Headset’s data is very reliable, as it comes digitally direct from our partner retailers. However, the potential does exist for misreporting in the instance of duplicates, incorrectly classified products, inaccurate entry of products into point-of-sale systems, or even simple human error at the point of purchase. Thus, there is a slight margin of error to consider. Brands listed on this page are ranked in the top twenty within the market and product category by total retail sales volume.

