.svg)
Sep-2026
Sales
Trend
6-Month
Product Count
SKUs
Avg Price
YoY Sales Change
YoY Price Change


Market Insights Snapshot
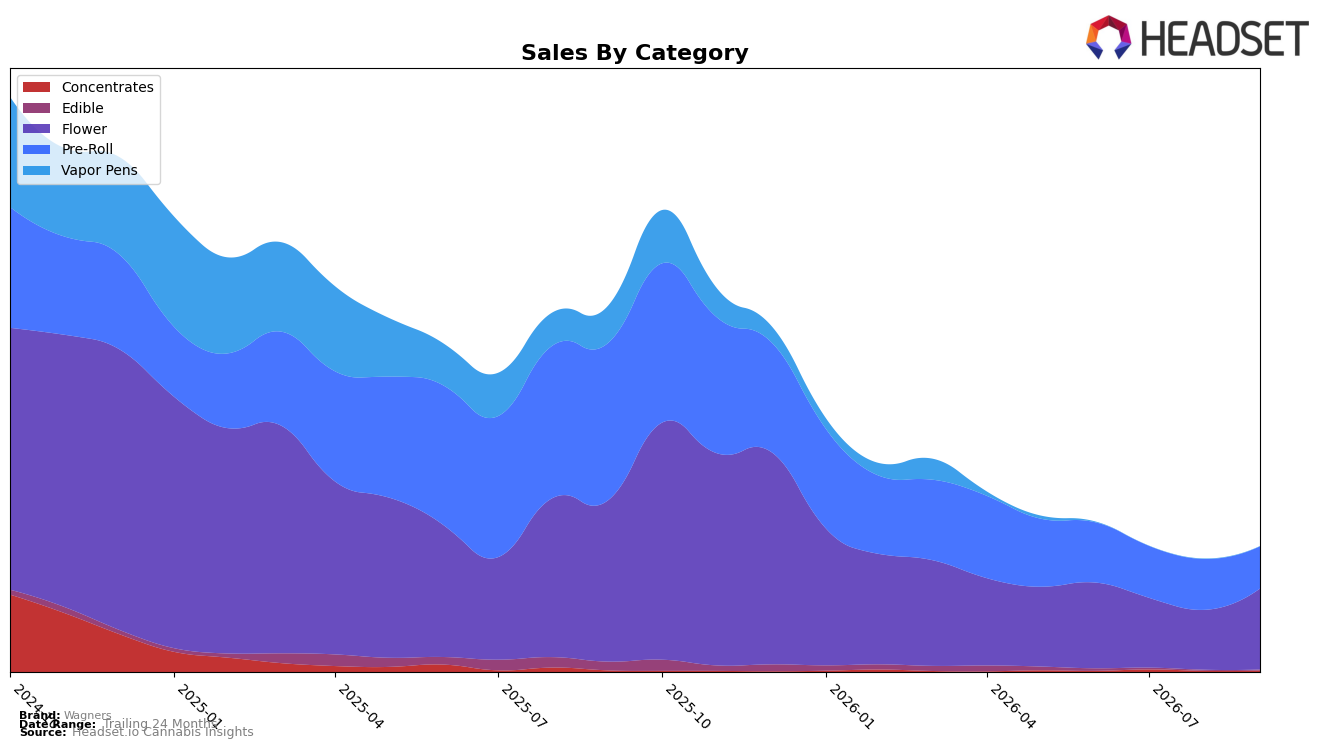
In September 2026, Wagners concentrated 64.63% of sales in Flower while Pre-Roll accounted for 33.61%, a mix that shifted toward Flower as its month-over-month change was +35.38% versus Pre-Roll at -17.09%. Year over year, Flower declined by 49.92% while Pre-Roll fell by 73.29%, widening the relative weight of Flower despite both categories contracting; meanwhile, Concentrates rose month over month by 30.71% but remained just 1.20% share, and Edible dropped 17.48% MoM with a 91.73% YoY decline and 0.56% share. With an average price up 44.42% year over year to $18.71 and Flower’s average price at 34.34, the mix skews toward higher-priced Flower even as total brand sales fell 65.83% YoY, indicating a pivot toward fewer, higher-value units over broader volume. In Ontario Flower, Wagners sits at rank 71 while the brand’s top category is Flower, implying category focus is aligned with market participation but leaves limited headroom at this rank for organic traffic without further mix productivity.
The mix and pricing shifts imply Wagners is consolidating around premiumish Flower while de-emphasizing lower-ticket Pre-Roll, a stance that raises average realized price (+44.42% YoY) but compresses unit throughput amid a 65.83% YoY sales decline. The 35.38% MoM rebound in Flower alongside a 17.09% MoM drop in Pre-Roll suggests near-term execution favors depth over breadth, yet the 71 rank in Ontario Flower signals limited shelf velocity unless the brand either widens entry price points or scales incremental formats; the 30.71% MoM lift in Concentrates from a 1.20% share base offers optionality, but the 91.73% YoY collapse in Edible and its 0.56% share point to a rationalized tail that lowers trial reach. Net effect: the brand’s positioning is tilting toward a concentrated, higher-price Flower offering that can defend margins month to month but risks under-penetration without complementary, lower-friction formats.
Competitive Landscape
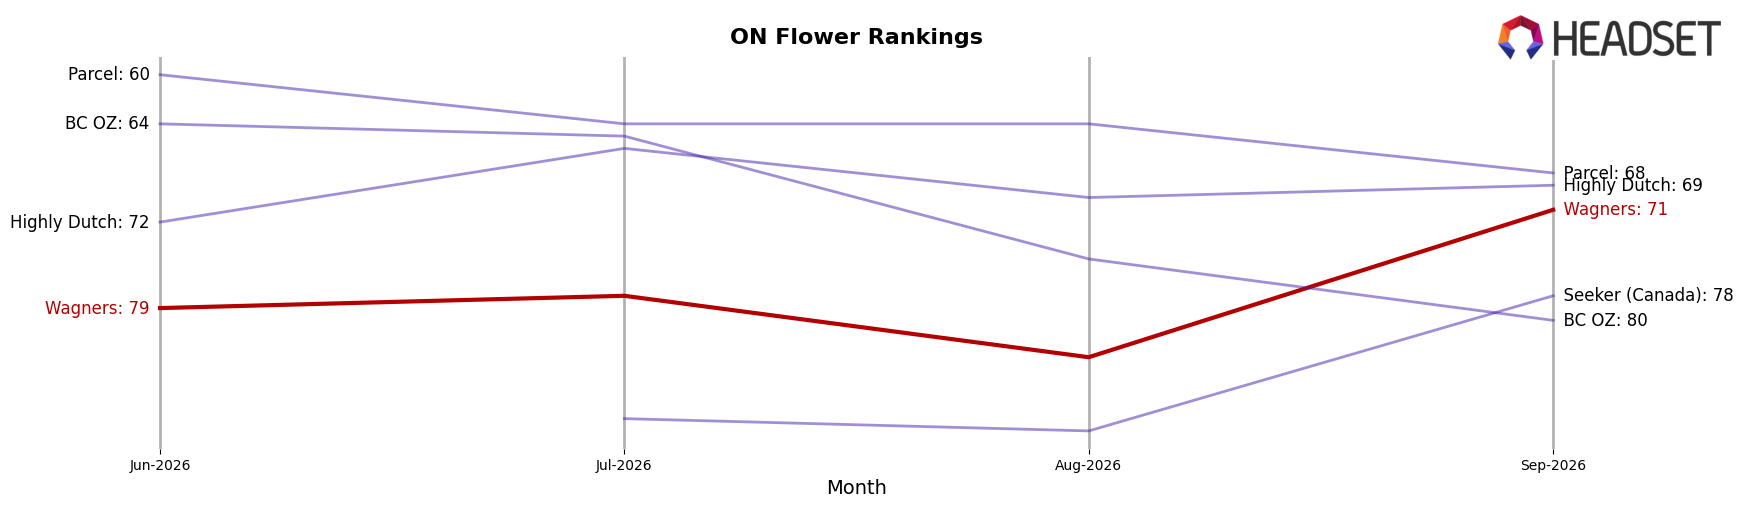
Wagners sits at rank #71 in ON Flower in September 2026, down 14 places year over year from #57, but up 8 spots versus June 2026 when it was #79; against this backdrop, Spinach moved from #3 to #1 while growing sales 15.7%, and FIGR climbed from #14 to #5 with a 51.7% YoY sales gain, indicating that share is consolidating toward faster risers even as Wagners remains 30 ranks below its September 2024 peak at #41. The contrast with Back Forty / Back 40 Cannabis, which slid from #1 to #3 alongside a 7.4% sales decline, suggests that Wagners’ recent 3-month improvement (+8 ranks) is a stabilization rather than a breakout, and the rank trajectory implies Wagners must convert short-term upticks into sustained quarterly gains to avoid further erosion against top-5 momentum brands.
Notable Products
Cherry Jam Shatter (1g) posted the standout move in September 2026 with a 288.5% month-over-month surge to $1,453 and jumped into rank 7, while Soft Black Hash (2g) plunged 71.8% and slid to rank 9; this divergence indicates concentrates are bifurcating between a breakout SKU and a retreating legacy format. Flower momentum clustered in Pink Bubba (14g) at rank 4 with a 63.7% MoM gain and Pink Bubba (7g) at rank 3 with a 36.2% rise, whereas Pre-Rolls compressed as Cherry Jam Pre-Roll 3-Pack (1.5g) fell 18.7% at rank 1 and Pink Bubba Pre-Roll 3-Pack (1.5g) declined 14.6% at rank 2; with three of the top ten in Pre-Roll, the category still concentrates share but is losing velocity. The combined pattern—expansion in higher-weight Flower packs alongside a breakout concentrate and softening multi-pack Pre-Rolls—implies Wagners is tilting toward potency- and value-forward formats that can carry higher unit economics and reduce reliance on Pre-Roll churn.
Top Selling Cannabis Brands






Data for this report comes from real-time sales reporting by participating cannabis retailers via their point-of-sale systems, which are linked up with Headset’s business intelligence software. Headset’s data is very reliable, as it comes digitally direct from our partner retailers. However, the potential does exist for misreporting in the instance of duplicates, incorrectly classified products, inaccurate entry of products into point-of-sale systems, or even simple human error at the point of purchase. Thus, there is a slight margin of error to consider. Brands listed on this page are ranked in the top twenty within the market and product category by total retail sales volume.

