.svg)

Sep-2026
Sales
Trend
6-Month
Product Count
SKUs
Avg Price
YoY Sales Change
YoY Price Change


Market Insights Snapshot
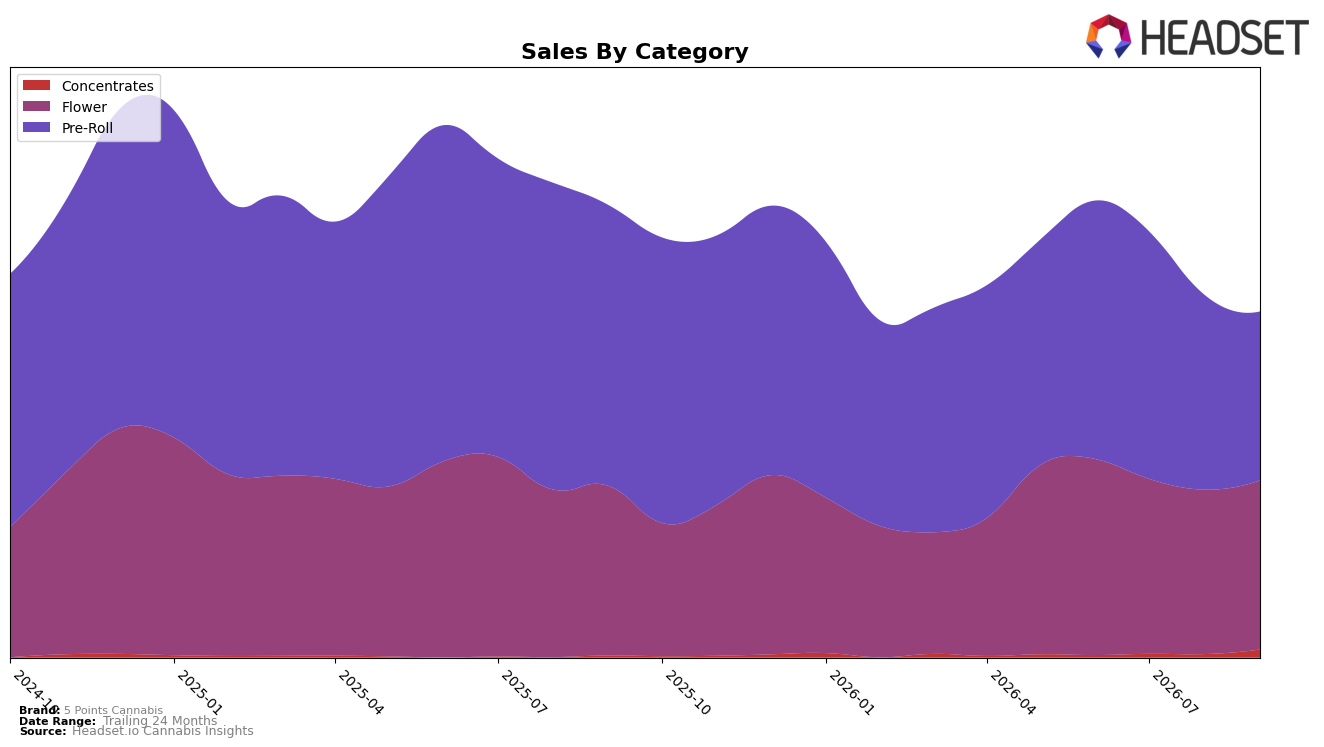
In September 2026, 5 Points Cannabis split nearly evenly between Flower at 48.20% share and Pre-Roll at 48.14% share, while Concentrates held 3.66% share; within this mix, Flower was roughly flat year over year at -0.22% and up month over month by 2.80%, whereas Pre-Roll fell -39.18% year over year and -12.93% month over month. Concentrates expanded 80.69% year over year and 52.35% month over month, but from a small base, and the brand’s overall average price fell -2.28% as category weights shifted toward an 18.66 average-price Pre-Roll and away from a 27.65 average-price Flower. With Pre-Roll ranking 57th in Ontario, the outsized Pre-Roll decline versus the modest Flower uptick implies mix-driven drag on total sales despite stability in higher-priced Flower.
The mix suggests a positioning crossroads: reliance on a large Pre-Roll base that is shrinking -39.18% year over year and -12.93% month over month pressures rank 57 in Ontario, while steadier Flower at -0.22% year over year and +2.80% month over month, plus Concentrates growing 80.69% year over year and 52.35% month over month, indicates room to pivot toward formats with better momentum. Given the 48.14% Pre-Roll share versus 48.20% in Flower, nudging share a few points into Flower and selectively scaling Concentrates could raise realized price above the current 22.32 average and counteract the brand-level -22.77% year-over-year sales decline.
Competitive Landscape
5 Points Cannabis sits at rank #57 in Ontario Pre-Roll in September 2026, down 22 places year over year from #35 and 14 places below its June 2026 position at #43, while its best historical mark was #28 in January 2025; in contrast, Back Forty / Back 40 Cannabis climbed from #2 to #1 with a 46.6% year-over-year sales increase and Spinach moved from #17 to #4 on 141.2% year-over-year growth, whereas General Admission slipped from #1 to #2 on a 38.2% decline. The divergence—5 Points Cannabis sliding 22 ranks YoY as peers move up or consolidate at the top—implies share is consolidating around faster-growing leaders, and without a reversal in trajectory the brand is likely to cede further rank to competitors accelerating from mid-tier positions.

Notable Products
The steepest decline came from Strawberry Kush Pre-Roll 10-Pack (3.5g), dropping 16.3% month over month while holding rank 2, and Durban Poison Pre-Roll 10-Pack (3.5g) slipped 10.0% at rank 9, whereas Blueberry Yum Yum Pre-Roll 10-Pack (3g) rose 17.7% to secure rank 1. Four of the top ten are Pre-Roll SKUs, and three are Flower SKUs, with Flower showing mixed pressure as Crumble Kush Milled (3.5g) fell 17.3% at rank 6 and Strawberry Kush (3.5g) eased 5.7% at rank 7. The split of gains at the top and double-digit pullbacks across mid-pack SKUs implies 5 Points Cannabis is consolidating demand into higher-velocity Pre-Roll formats while Flower breadth thins, guiding assortment toward scaled Pre-Roll multipacks and fewer mid-tier Flower bets.
Top Selling Cannabis Brands






Data for this report comes from real-time sales reporting by participating cannabis retailers via their point-of-sale systems, which are linked up with Headset’s business intelligence software. Headset’s data is very reliable, as it comes digitally direct from our partner retailers. However, the potential does exist for misreporting in the instance of duplicates, incorrectly classified products, inaccurate entry of products into point-of-sale systems, or even simple human error at the point of purchase. Thus, there is a slight margin of error to consider. Brands listed on this page are ranked in the top twenty within the market and product category by total retail sales volume.

