.svg)

Sep-2026
Sales
Trend
6-Month
Product Count
SKUs
Avg Price
YoY Sales Change
YoY Price Change


Where to Buy
Charge Bar is stocked at 86 licensed dispensaries across Massachusetts, with the deepest coverage in Boston, Brockton, Worcester, Greenfield, and Lynn. Search by ZIP code or city below to find the closest one.
Market Insights Snapshot
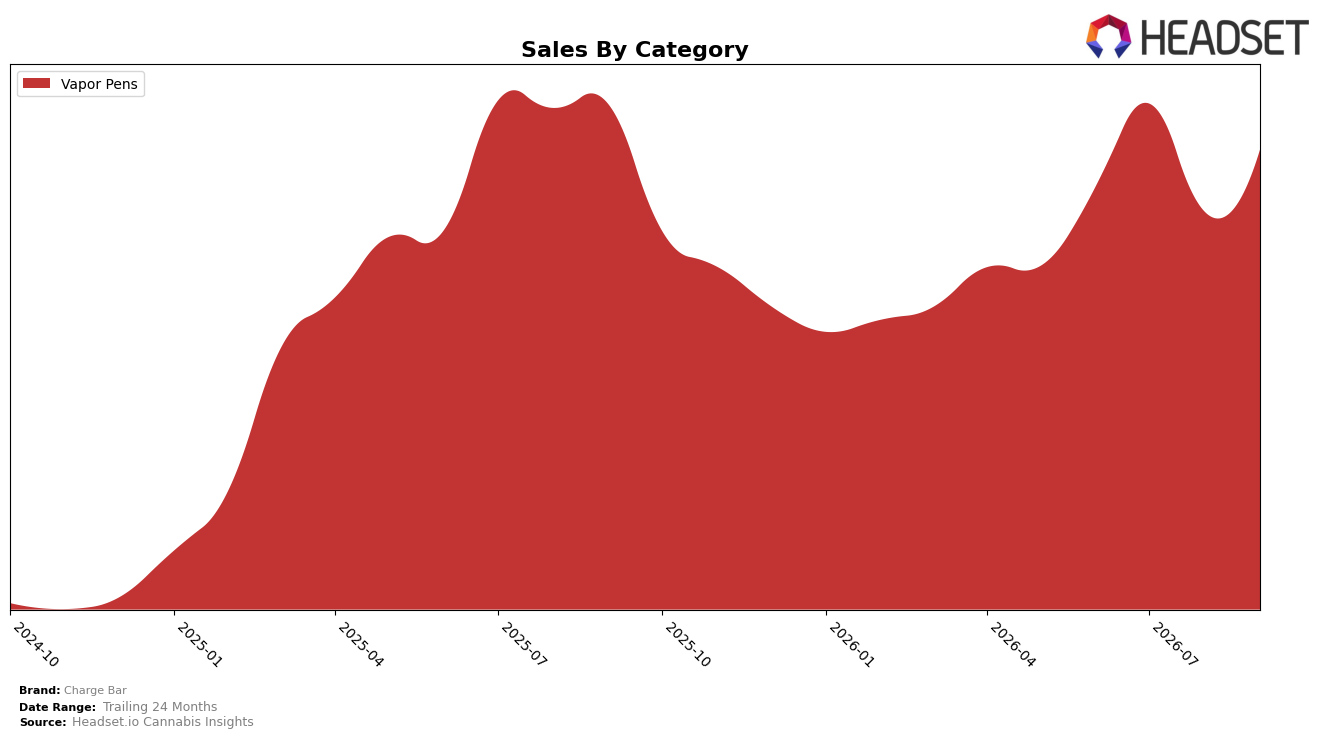
Charge Bar concentrated 100.0% of September 2026 sales in Vapor Pens, with category sales up 15.19% month over month but down 8.86% year over year; the average price fell 2.63% YoY while the brand’s 24‑month sales increase stood at 2121.31%. Within Massachusetts Vapor Pens, Charge Bar held rank 12, implying share gains likely came from volume rather than pricing as MoM growth outpaced price movement, while the YoY decline signals anniversary headwinds despite a full-category focus.
The mix concentration at 100.0% in Vapor Pens paired with a rank of 12 and a 15.19% MoM lift suggests Charge Bar is climbing via unit momentum in September 2026, whereas the 8.86% YoY dip and 2.63% YoY price decrease indicate pressure on premium positioning within the segment. This pattern implies the brand’s competitive path is to trade on accessibility—using modest price compression to unlock volume—and that maintaining or improving rank will depend on sustaining mid‑teens monthly growth to offset year‑over‑year softness.
Competitive Landscape
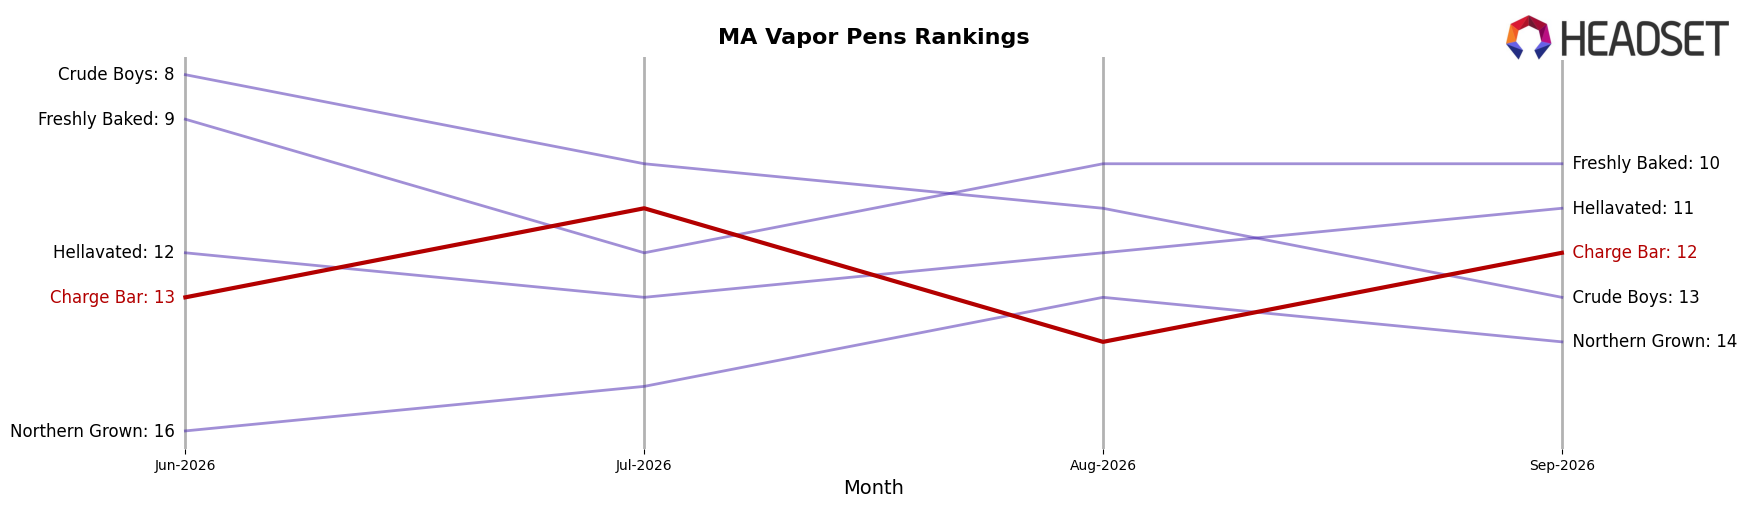
Charge Bar sits at rank #12 in MA Vapor Pens in September 2026, down 5 positions from rank #7 year over year, and 1 position above its June 2026 mark of #13, while still 5 places below its peak at #7 in September 2025; meanwhile, Fernway held at #1 year over year with a 43.6% sales increase as Jeeter surged from #23 to #4 on 421.5% growth, indicating that Charge Bar’s slipping rank amid upward moves by leading rivals points to share being redistributed toward faster-scaling competitors rather than broad category contraction.
Notable Products
With no month-over-month percentages provided for September 2026, the standout move is rank-based: Do Si Do x Melonade Distillate Dual Chamber Disposable (2g) holds rank 1 while Passion Fruit x Girl Scout Cookies Distillate Dual Chamber Disposable (2g) sits at rank 3, indicating the dual-chamber format anchors the top tier rather than a single-flavor 1g entry at rank 2. Eight of the top ten are Vapor Pens in disposable formats, and two of the top three are 2g dual-chamber SKUs, concentrating share at the high-capacity end; Island Haze Distillate Cartridge (1g) at rank 2 is the lone cartridge competing at the very top against higher-capacity peers. The sales gap between the rank 1 and rank 2 SKUs widens materially ($59,614 vs a lower figure at rank 2), while the 2g Citrus Slushy x Electric Apple Distillate Disposable (2g) at rank 8 signals depth beyond the top three, implying Charge Bar’s commercial direction is tilting toward larger, blended 2g disposables as the flagship format.
Top Selling Cannabis Brands






Data for this report comes from real-time sales reporting by participating cannabis retailers via their point-of-sale systems, which are linked up with Headset’s business intelligence software. Headset’s data is very reliable, as it comes digitally direct from our partner retailers. However, the potential does exist for misreporting in the instance of duplicates, incorrectly classified products, inaccurate entry of products into point-of-sale systems, or even simple human error at the point of purchase. Thus, there is a slight margin of error to consider. Brands listed on this page are ranked in the top twenty within the market and product category by total retail sales volume.

