.svg)


Where to Buy
Charlies is stocked at 20 licensed dispensaries across Arizona, with the deepest coverage in Mesa, Phoenix, Flagstaff, Tucson, and Apache Junction. Search by ZIP code or city below to find the closest one.
Market Insights Snapshot
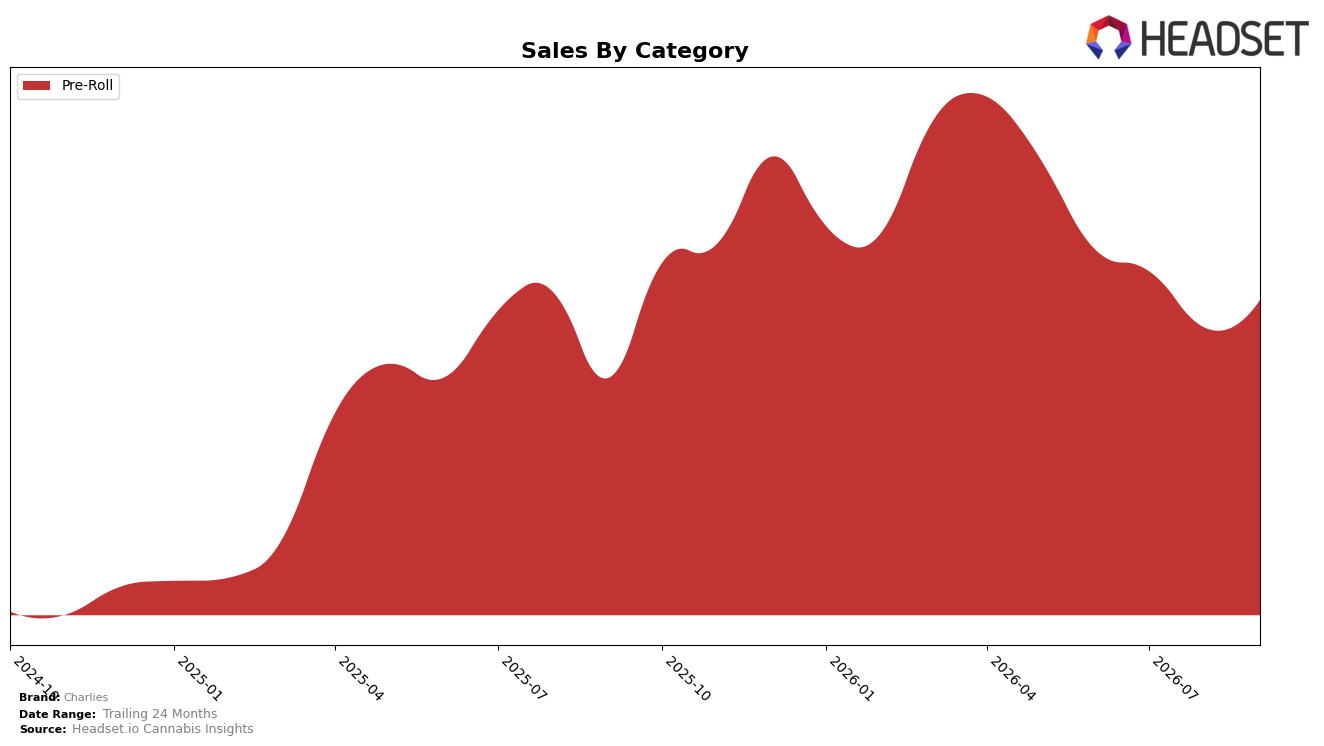
In September 2026, Charlies operated as a single-category brand with Pre-Roll at 100.0% of sales, posting year-over-year growth of 17.2% alongside a month-over-month lift of 5.5%. Average price fell 19.8% year over year while sales rose 17.2%, indicating unit expansion outweighed price compression; within Pre-Roll the average price sat at $18.55 as category share remained at 100.0%. With Arizona as the top market and a rank of 20 in Pre-Roll, the combination of a 5.5% monthly gain and a 19.8% price decline points to volume-led momentum rather than mix-driven gains, implying demand elasticity within the Pre-Roll segment that can sustain growth without near-term diversification.
The shift toward lower prices alongside a 17.2% annual sales increase and a 5.5% monthly uptick suggests Charlies is positioned as a volume mover in Pre-Roll rather than a premium price taker, anchoring its competitive stance through accessible pricing. Holding 100.0% of sales in a single category while ranking 20 in Pre-Roll in Arizona implies that incremental rank improvement likely depends more on sustaining mid‑single‑digit monthly volume growth than on further price cuts, given nearly 20% annual price compression already realized; the pattern indicates headroom via distribution depth and repeat rates, not category expansion.
Competitive Landscape
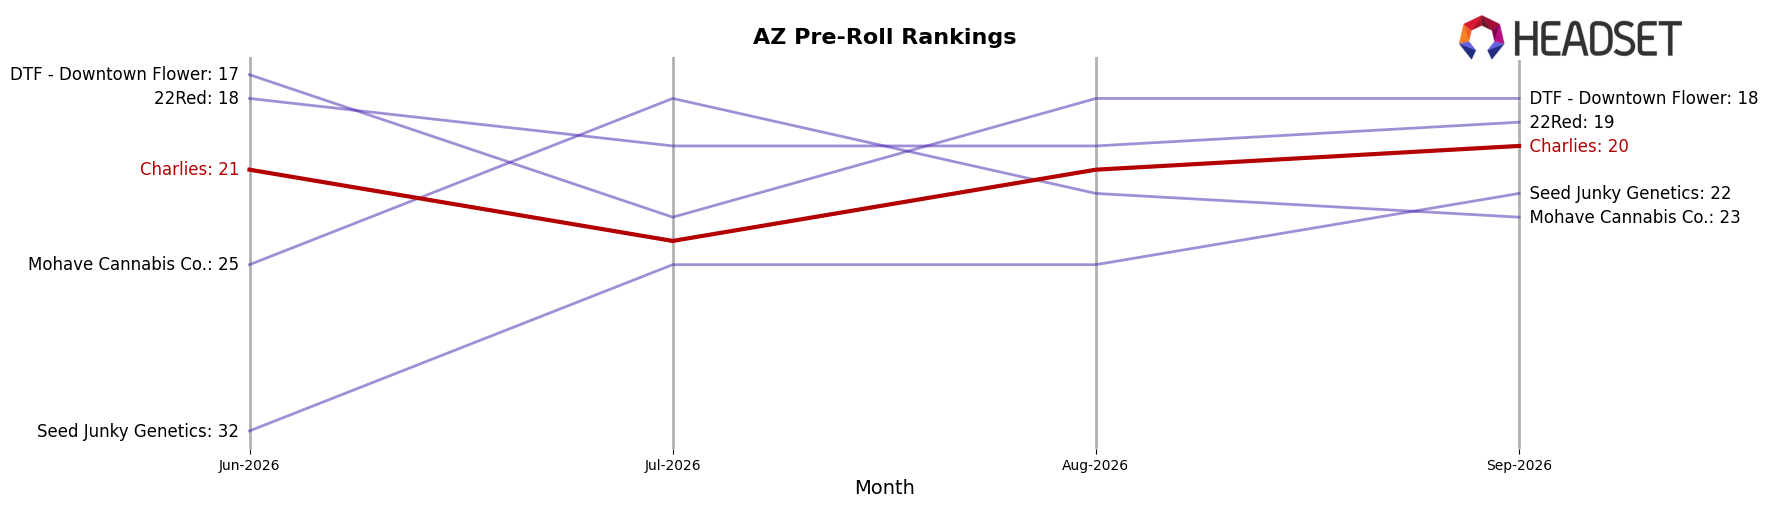
Charlies ranks #20 in AZ Pre-Roll for September 2026 with no year-over-year rank change from #20, while its three-month position was #21 and its peak of #16 came in November 2025; in contrast, Jeeter holds #1 with a 16.8% YoY sales increase and STIIIZY sits at #2 despite a −20.3% YoY sales decline, and Anthem surged from #39 to #4 alongside an 851.7% YoY sales jump. This stable #20 YoY rank paired with a recent #21 to #20 uptick indicates Charlies is holding share amid rapid top-tier churn, implying that further gains will require displacing fast-rising mid-pack entrants rather than chasing entrenched leaders.
Notable Products
Animal Tree Pre-Roll 5-Pack (3g) posted the standout move in September 2026 with a +76.6% month-over-month surge and a climb to rank 1, while Charlies x Canamo - Grape Milkshake x Peachscream Infused Pre-Roll 2-Pack (1.4g) fell -23.8% and sat at rank 7. Miracle Alien Cookies Pre-Roll 5-Pack (3g) advanced +35.3% and held rank 3, and six of the top ten were 5-Pack Pre-Roll SKUs, signaling concentration in multi-pack formats. With rank 1 and rank 3 both occupied by non-infused 5-Packs and only one infused SKU declining double-digits, the mix points to a pivot toward value-oriented multi-pack pre-rolls over smaller infused 2-Packs.
Top Selling Cannabis Brands






Data for this report comes from real-time sales reporting by participating cannabis retailers via their point-of-sale systems, which are linked up with Headset’s business intelligence software. Headset’s data is very reliable, as it comes digitally direct from our partner retailers. However, the potential does exist for misreporting in the instance of duplicates, incorrectly classified products, inaccurate entry of products into point-of-sale systems, or even simple human error at the point of purchase. Thus, there is a slight margin of error to consider. Brands listed on this page are ranked in the top twenty within the market and product category by total retail sales volume.

