.svg)

Aug-2026
Sales
Trend
6-Month
Product Count
SKUs
Avg Price
YoY Sales Change
YoY Price Change


Where to Buy
Anthem is stocked at 486 licensed dispensaries across New York, Illinois, and 3 other states, 214 of them in New York, with the deepest coverage in New York, Brooklyn, Queens, Staten Island, and The Bronx. Search by ZIP code or city below to find the closest one.
Market Insights Snapshot
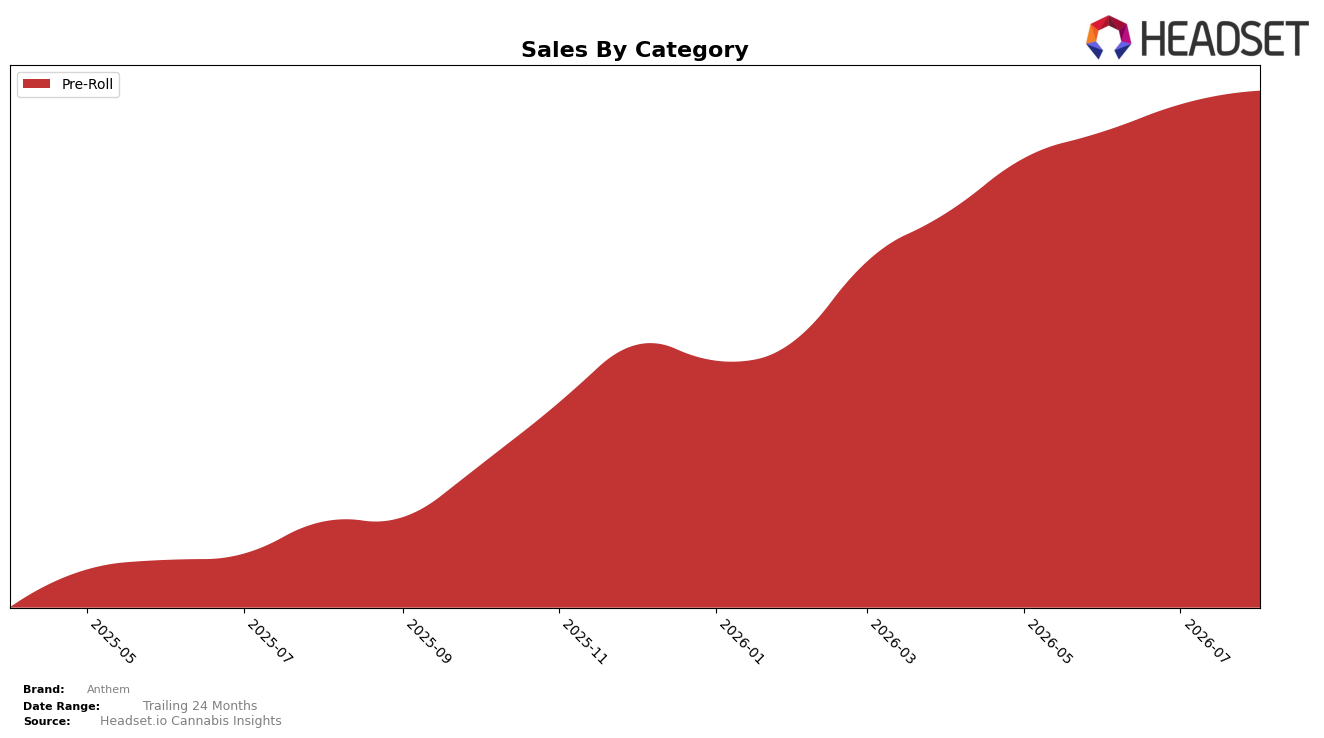
Anthem’s August 2026 mix is fully concentrated in Pre-Roll at 100.0% share, with category sales up 297.98% year over year and 2.43% month over month, while average price fell 22.69% YoY to $23.16 and likely eased sequentially given the slight MoM lift in sales alongside stable category exclusivity. The brand holds rank 3 in Pre-Roll in New York, and the combination of triple-digit YoY growth with a 2-position-or-fewer cushion to the top spot suggests the price elasticity shift is expanding volume faster than price declines are eroding revenue, implying Anthem is trading scale for share defense within a single-category footprint.
The 100.0% Pre-Roll dependence, paired with a 297.98% YoY surge and only a 2.43% MoM uptick, indicates Anthem’s positioning is anchored in aggressive volume capture through lower average prices rather than portfolio diversification; in practical terms, the 22.69% YoY price drop functions as a share lever rather than a margin lever at rank 3. In New York, holding the number 3 slot while cutting price by 22.69% and growing sales nearly 3x YoY implies Anthem is prioritizing sustained shelf velocity over premium signaling, setting a path where maintaining 100.0% category focus can reinforce brand identity but leaves exposure to Pre-Roll cyclicality unless MoM growth outpaces peers sufficiently to close the gap above rank 3.
Competitive Landscape
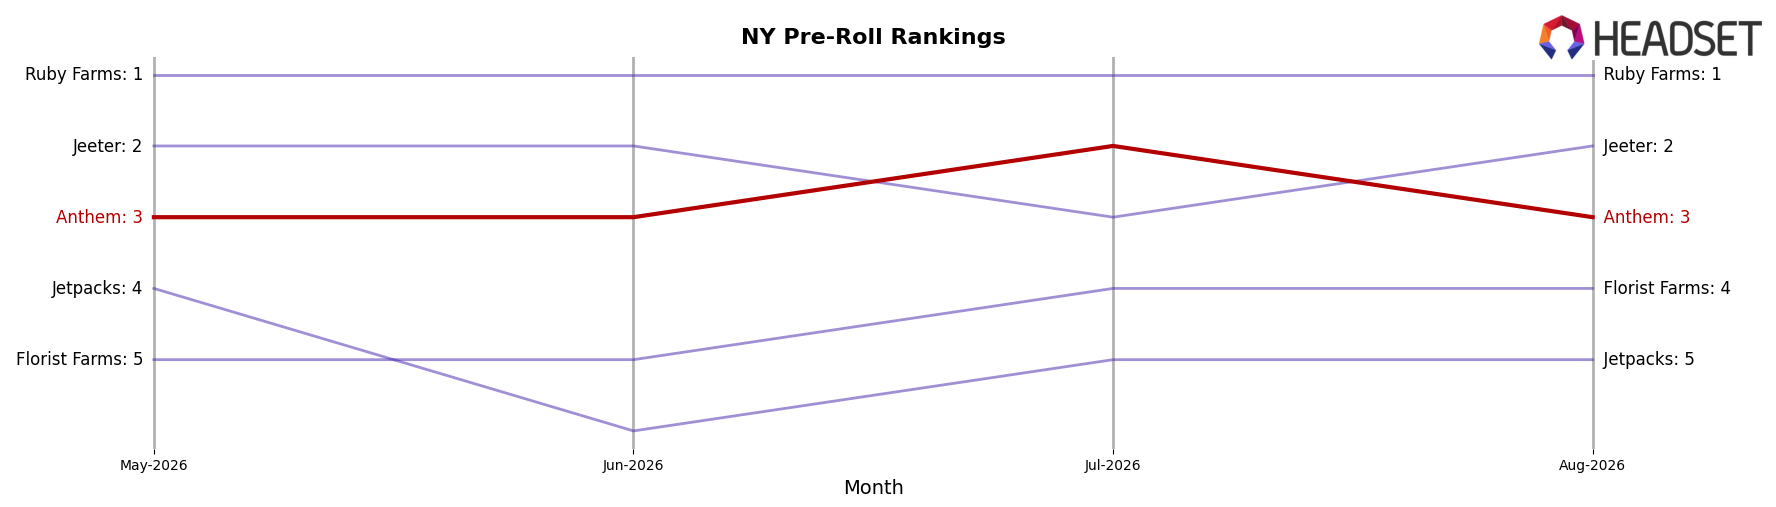
Anthem is ranked #3 in NY Pre-Roll in August 2026, up 24 positions year over year from #27, and it has held #3 for three months while peaking at #2 in July 2026; by comparison, Jeeter climbed from #308 to #2 and Ruby Farms remains #1 with a 10.2% YoY sales increase, whereas Jetpacks sits at #5 with a 20.0% YoY sales decline. With Florist Farms at #4 and posting 27.3% YoY sales growth, Anthem’s improvement from #27 to #3 alongside a July 2026 peak at #2 indicates a trajectory toward stable top-tier positioning rather than rapid displacement dynamics seen in faster risers.
Notable Products
Tangie Dream Infused Pre-Roll (1g) posted the most notable move with a 26.95% month-over-month gain to rank 7, while Watermelon Z Infused Pre-Roll 5-Pack (2.5g) slipped 8.07% at rank 10, indicating single-count infused SKUs are expanding share against multi-pack infused formats. The top three ranks are held by non-infused 10-pack blends—Hybrid Blend Pre-Roll 10-Pack (3.5g) up 10.08% at rank 1 and Indica Blend Pre-Roll 10-Pack (3.5g) up 6.06% at rank 3, with Sativa Blend Pre-Roll 10-Pack (3.5g) nearly flat at -0.17% at rank 2—while five of the top ten are infused Pre-Roll SKUs, concentrating demand in potency-led variants. Bold - Acapulco Gold Infused Pre-Roll 5-Pack (2.5g) rose 21.31% to rank 5 versus the 1g Watermelon Z Infused Pre-Roll up 8.24% at rank 4, pointing to pack-size bifurcation where value 5-packs win only when paired with branded strain equity. The mix implies Anthem is pivoting toward an anchored core of consistent non-infused 10-packs supplemented by selectively scaled infused strains, steering the portfolio toward potency-led trial without displacing the blended pack volume base.
Top Selling Cannabis Brands






Data for this report comes from real-time sales reporting by participating cannabis retailers via their point-of-sale systems, which are linked up with Headset’s business intelligence software. Headset’s data is very reliable, as it comes digitally direct from our partner retailers. However, the potential does exist for misreporting in the instance of duplicates, incorrectly classified products, inaccurate entry of products into point-of-sale systems, or even simple human error at the point of purchase. Thus, there is a slight margin of error to consider. Brands listed on this page are ranked in the top twenty within the market and product category by total retail sales volume.

