Jun-2026
Sales
Trend
6-Month
Product Count
SKUs
Avg Price
YoY Sales Change
YoY Price Change
Market Insights Snapshot
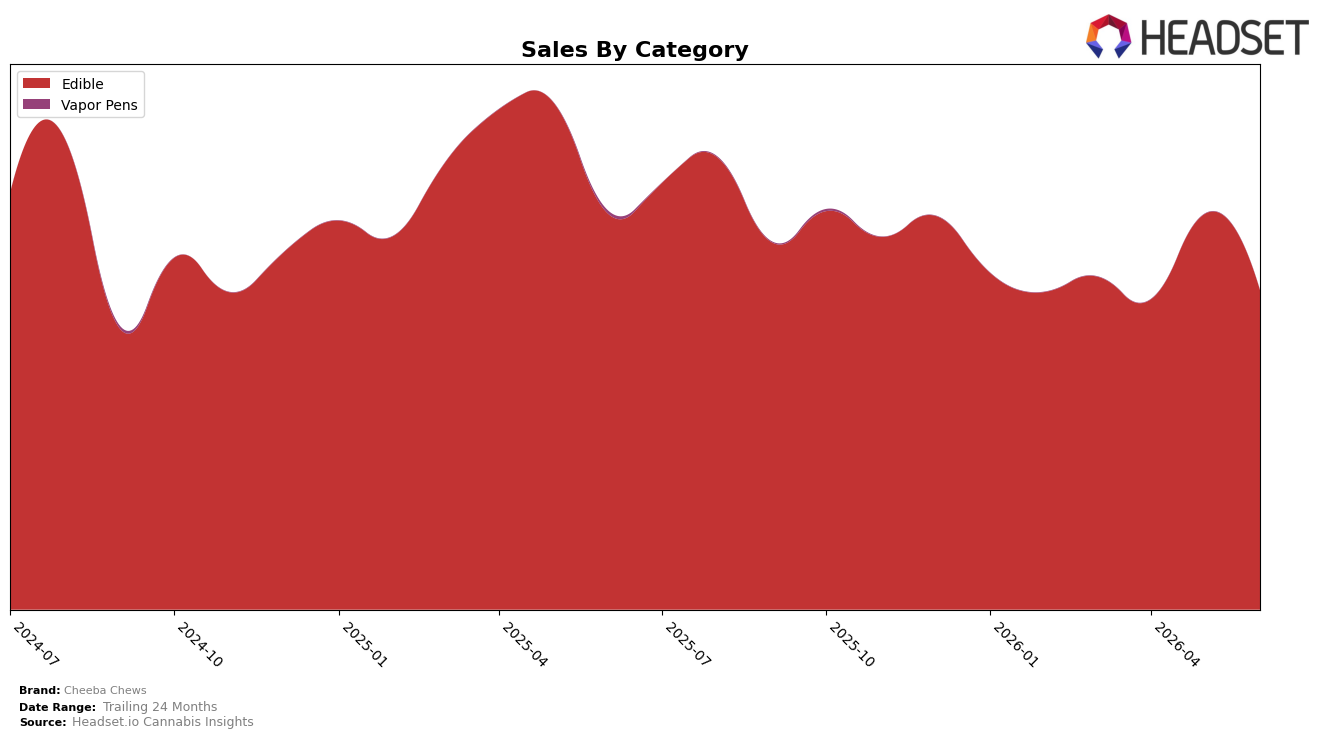
Cheeba Chews operated as a single-category brand in June 2026, with Edible accounting for 100.0% of sales, while brand-level sales declined 19.86% year over year and 24‑month growth stood at 10.73%. Within Edible, category sales fell 19.30% YoY and 19.28% month over month, alongside a 3.61% YoY decrease in average price to $19.93, indicating that volume did not offset softer pricing. Given a June 2026 Edible rank of 16 in Nevada, the combination of 100.0% category concentration and double‑digit MoM and YoY declines implies overexposure to a weakening demand pocket and limited internal hedges against month‑to‑month volatility.
The uniform 100.0% mix in Edible, paired with a 19.28% MoM contraction and a 19.30% YoY drop, suggests that Cheeba Chews’ positioning hinges on price‑sensitive repeat occasions where a 3.61% YoY price reduction did not convert into share defense. Holding rank 16 in Nevada while average prices eased indicates that elasticity gains are muted, so June 2026 performance implies the brand needs either mix diversification or format innovation within Edible to stabilize rank trajectory when pricing levers contribute less than expected to volume.
Competitive Landscape
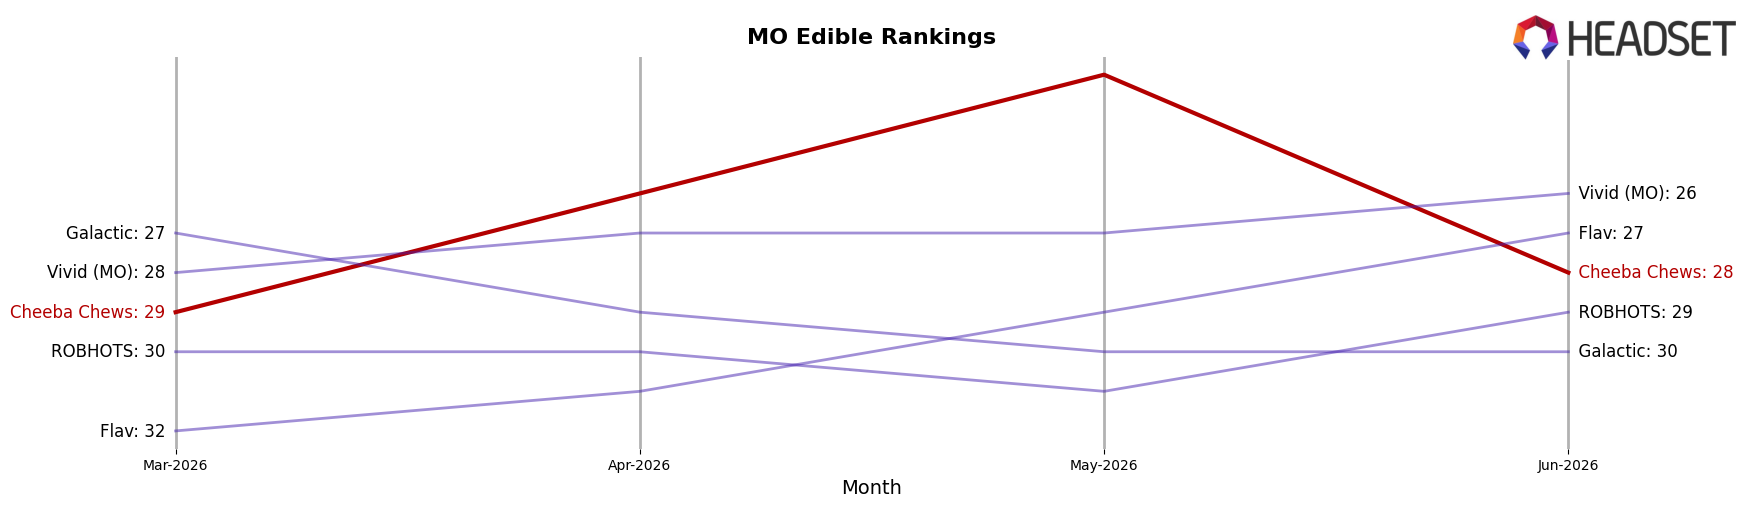
Cheeba Chews sits at rank #28 in MO Edible in June 2026, improving 4 positions year over year from #32 and slipping 1 spot from March 2026’s #29, while peaking at #23 in May 2026 before a 5-position pullback; in contrast, Good Day Farm advanced from #4 to #2 as its sales grew 19.4% year over year, and Smokiez Edibles fell from #2 to #5 with a 23.4% sales decline, indicating Cheeba Chews’ mid-pack gains are fragile amid faster-moving leaders and retreating incumbents. The pattern implies a ceiling near the low-20s unless Cheeba Chews converts its May 2026 peak into sustained share capture against competitors that are either accelerating upward or yielding ground.
Notable Products
Hybrid Caramel Sea Salt Caramel Taffy 10-Pack (100mg) posted the steepest decline in June 2026 at -33.9% and slid to rank 5, while the CBN/THC 1:2 Sleepy Time Chocolate Taffy Chew 20-Pack (50mg CBN, 100mg THC) dipped -11.3% but held rank 1. In contrast, the CBD/THC/CBG 1:1:1 Trifecta Be Happy Caramel Taffy 10-Pack (100mg CBD, 100mg THC, 100mg CBG) climbed +44.3% to rank 4, and the Sativa Chocolate Taffy 10-Pack (100mg) eased -3.5% at rank 3. With eight of the top ten in June 2026 concentrated in Edible multipacks and only one SKU posting a double-digit gain below +50%, the mix points to reliance on sleep and mood formulations to offset volatility in classic caramel flavors, suggesting Cheeba Chews is tilting assortment weight toward function-led SKUs over legacy taste-led variants despite a $34,070 leader anchoring the lineup.
Top Selling Cannabis Brands
Data for this report comes from real-time sales reporting by participating cannabis retailers via their point-of-sale systems, which are linked up with Headset’s business intelligence software. Headset’s data is very reliable, as it comes digitally direct from our partner retailers. However, the potential does exist for misreporting in the instance of duplicates, incorrectly classified products, inaccurate entry of products into point-of-sale systems, or even simple human error at the point of purchase. Thus, there is a slight margin of error to consider. Brands listed on this page are ranked in the top twenty within the market and product category by total retail sales volume.

