Jun-2026
Sales
Trend
6-Month
Product Count
SKUs
Avg Price
YoY Sales Change
YoY Price Change
Market Insights Snapshot
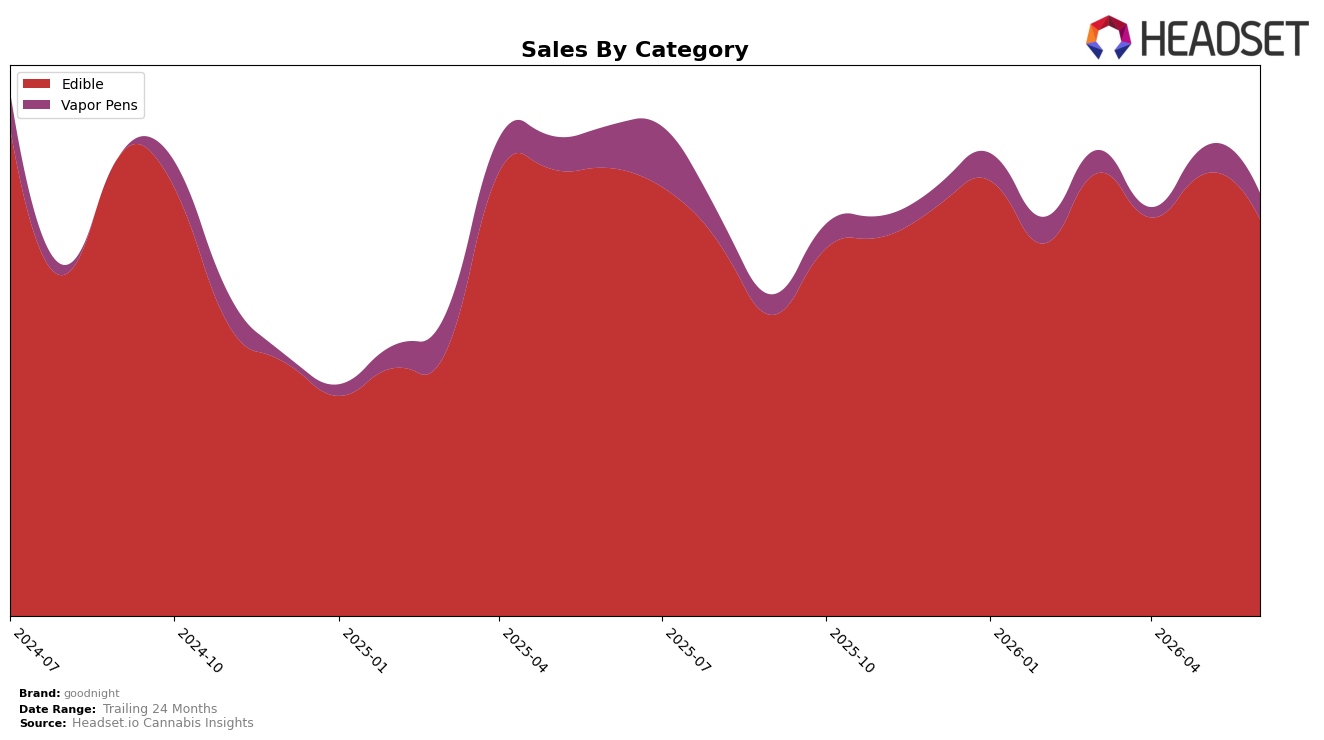
Edible accounts for 88.17% share in June 2026 with a year-over-year decline of 10.69% and a month-over-month drop of 9.57%, while Vapor Pens holds 11.83% share with a steeper year-over-year decline of 21.78% but a smaller month-over-month dip of 1.89%. Within Edible, the average price is $35.90, down alongside the brand-wide average price decline of 7.33% year over year, and Vapor Pens averages $31.27; the combined pattern maps to a brand-level year-over-year sales contraction of 12.16% and a 24.81% slide vs 24 months, implying that category concentration in Edible is amplifying downside when that core bucket softens and that pricing actions are not yet offsetting volume pressure.
In Missouri Edibles, goodnight sits at rank 25 while Edible share is 88.17% and Vapor Pens is 11.83%, indicating a mid-pack position that rises or falls with Edible volatility rather than diversification. With Edible down 9.57% month over month versus Vapor Pens down 1.89% month over month, the near-term mix tilts exposure toward the more volatile leg, suggesting the brand’s positioning is that of a category specialist whose performance will hinge on stabilizing Edible velocity or rebalancing toward formats showing comparatively smaller monthly swings.
Competitive Landscape
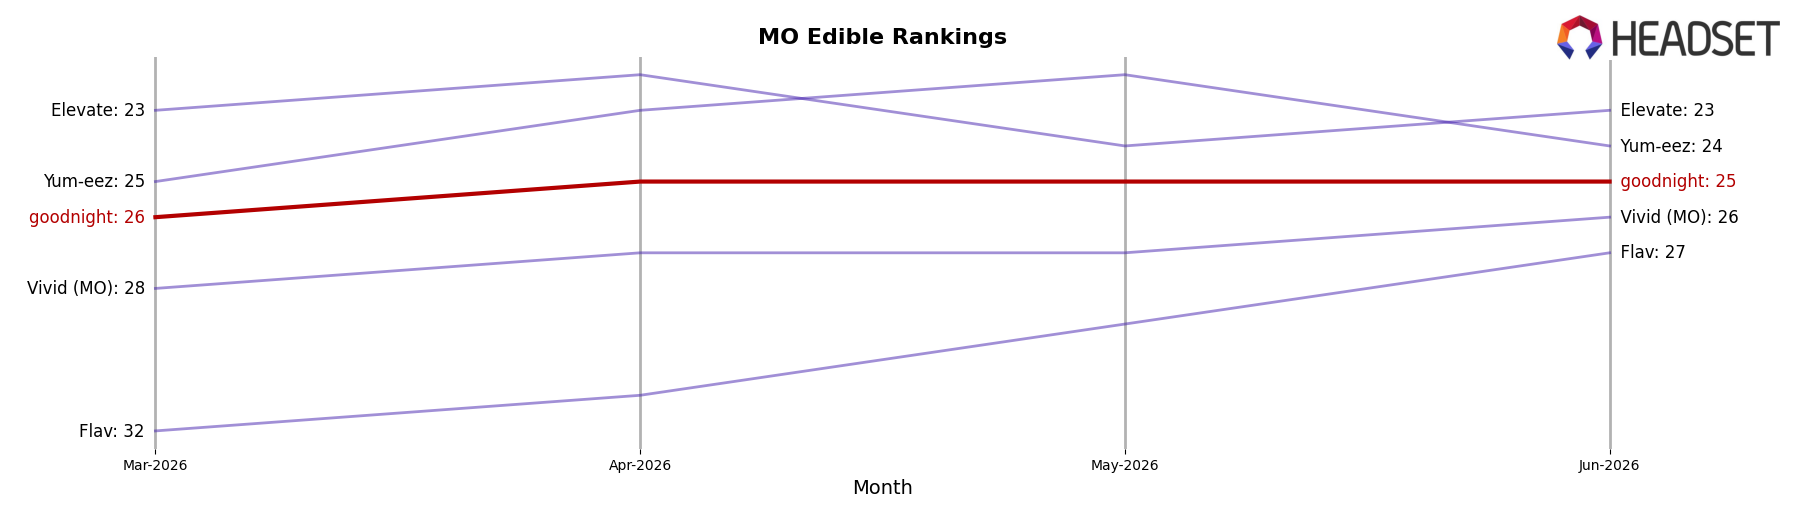
goodnight is ranked #25 in MO Edible in June 2026, unchanged year over year at #25, while edging up 1 position from #26 three months ago; against its own history, this sits 6 places below its peak at #19 in September 2024. In contrast, Gron / Grön held #1 year over year and in June 2026 despite a -13.1% YoY sales change, and Good Day Farm climbed from #4 to #2 alongside +19.4% YoY sales growth, indicating competitors are consolidating top-tier positions even with mixed growth rates. The combination of a flat YoY rank at #25 and only a 1-position improvement since March 2026 implies goodnight’s trajectory is stabilizing in the lower mid-pack, requiring step-change gains to re-approach the #19 peak level.
Notable Products
CBD/THC/CBN 1:1:1 Dreamberry Gummies 10-Pack (100mg CBD, 100mg THC, 100mg CBN) posted the steepest decline at -45.5% MoM while holding rank 5 in June 2026, contrasting with CBD/CBN/THC 1:1:1 Dreamberry Gummies 20-Pack (100mg CBD, 100mg THC, 100mg CBN) up 37.7% MoM at rank 4. The top seller, CBD/CBN/THC 1:1:1 Dreamberry Gummies 40-Pack (100mg CBD, 100mg THC, 100mg CBN ), rose 2.1% MoM at rank 1 and generated $92,772, whereas the higher-dosage CBD/THC/CBN 1:1:1 Dreamberry Gummies 40-Pack (300mg CBD, 300mg THC, 300mg CBN, 0.3oz) fell -24.0% MoM at rank 2. With four of the top ten concentrated in Edible gummies but moving in opposite directions across pack sizes and potencies, the mix implies goodnight is skewing toward value and accessible dosing while premium-strength formats face elasticity pressure.
Top Selling Cannabis Brands
Data for this report comes from real-time sales reporting by participating cannabis retailers via their point-of-sale systems, which are linked up with Headset’s business intelligence software. Headset’s data is very reliable, as it comes digitally direct from our partner retailers. However, the potential does exist for misreporting in the instance of duplicates, incorrectly classified products, inaccurate entry of products into point-of-sale systems, or even simple human error at the point of purchase. Thus, there is a slight margin of error to consider. Brands listed on this page are ranked in the top twenty within the market and product category by total retail sales volume.

