Jun-2026
Sales
Trend
6-Month
Product Count
SKUs
Avg Price
YoY Sales Change
YoY Price Change
Market Insights Snapshot
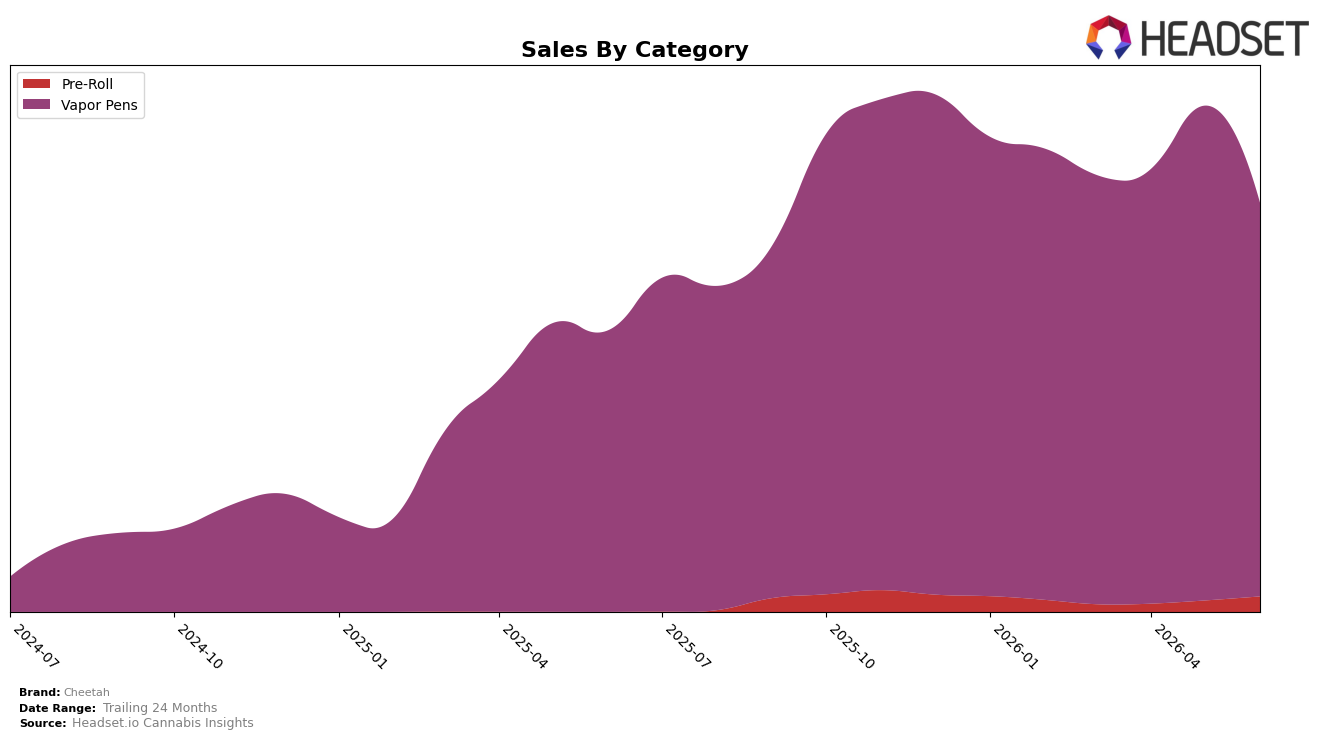
In June 2026, Cheetah’s mix concentrated 96.20% in Vapor Pens while Pre-Roll rose to 3.80% share, with Vapor Pens down 20.45% month over month but up 39.87% year over year, and Pre-Roll up 35.59% month over month and 27,481.74% year over year. Brand-wide sales advanced 45.36% year over year alongside an 11.35% decline in average price, and Vapor Pens held rank 11 in New Jersey while the brand’s top category remained Vapor Pens; this mix implies the Vapor Pen core is expanding on a yearly basis even as a price-led pullback and monthly contraction open room for the newly scaled Pre-Roll line to absorb incremental demand.
The simultaneous 39.87% year-over-year growth and 20.45% month-over-month contraction in Vapor Pens, paired with a 27,481.74% year-over-year surge and 35.59% month-over-month gain in Pre-Roll, indicates Cheetah is de-risking category concentration by nurturing a secondary volume engine while maintaining a rank 11 foothold in New Jersey. With average price down 11.35% amid a 45.36% year-over-year sales increase and Vapor Pens still at 96.20% share, the pattern implies a price-elastic, share-defensive stance where sustained yearly momentum in the core funds rapid Pre-Roll penetration, positioning the brand to convert seasonal Vapor Pen softness into diversified sell-through.
Competitive Landscape
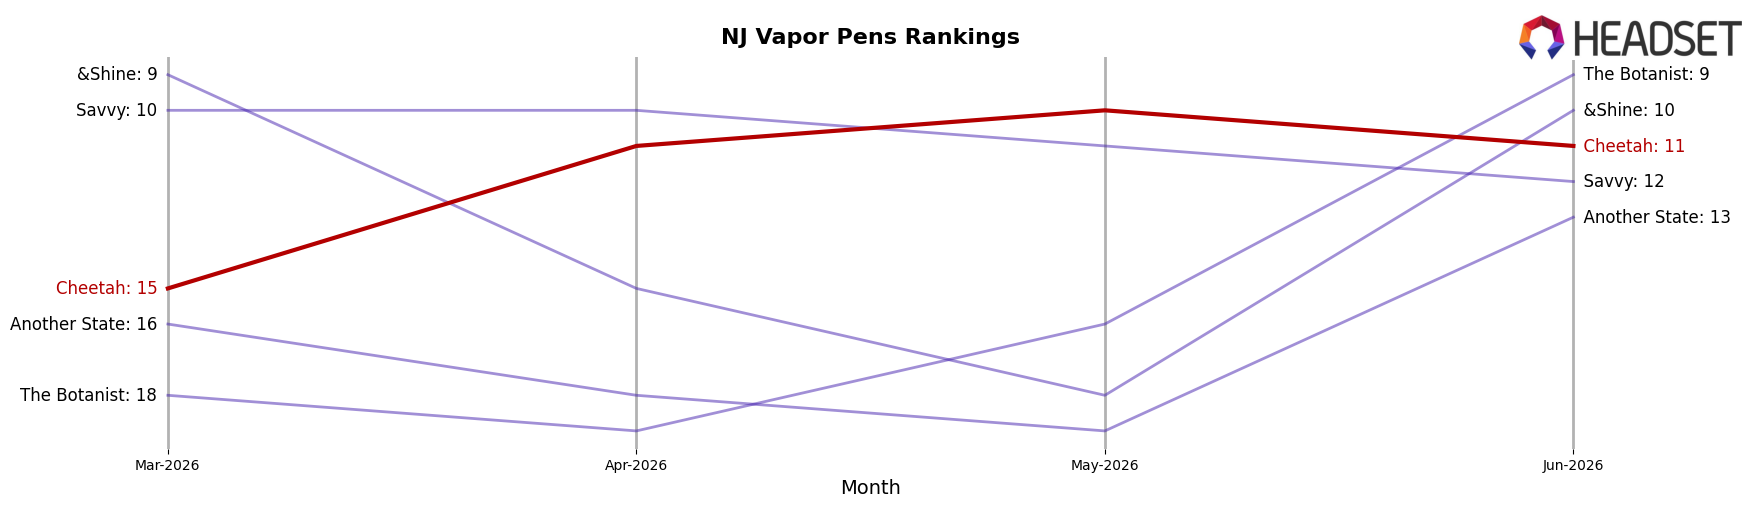
Cheetah sits at rank #11 in New Jersey Vapor Pens in June 2026, improving 12 positions from #23 year over year, while slipping 1 spot from its #10 peak in May 2026 and rising 4 places from #15 in March 2026; in contrast, Select held #1 with a -8.6% year-over-year sales change as Fernway maintained #2 with +10.7% and RYTHM moved into #5 with +26.0%, indicating Cheetah’s upward rank shift is outpacing lower-growth leaders but still lags the acceleration of mid-pack climbers. The combination of a year-over-year climb from #23 to #11 and a month-over-month dip from #10 to #11 implies momentum is improving on a yearly basis but may be fragile near the top tier, suggesting near-term share gains require defending recent advances while targeting the gap to the #5–#2 cohort.
Notable Products
Gelato Cream Cake Live Resin Disposable (1g) posted the steepest movement in June 2026 with a -11.31% month-over-month change at rank 8, while Purple Milk Live Rosin Disposable (1g) led the table at rank 1 despite a -29.09% decline. GMO Live Rosin Disposable (1g) rose by 3.71% at rank 3, and Gorilla Glue #4 Live Rosin Disposable (1g) gained 19.16% at rank 9. Eight of the top ten are Vapor Pens, and that concentration alongside a single Pre-Roll at rank 6 and a $55,702 peak for a new entrant implies Cheetah is leaning into breadth within pens while tolerating volatility at the top to sustain category dominance.
Top Selling Cannabis Brands
Data for this report comes from real-time sales reporting by participating cannabis retailers via their point-of-sale systems, which are linked up with Headset’s business intelligence software. Headset’s data is very reliable, as it comes digitally direct from our partner retailers. However, the potential does exist for misreporting in the instance of duplicates, incorrectly classified products, inaccurate entry of products into point-of-sale systems, or even simple human error at the point of purchase. Thus, there is a slight margin of error to consider. Brands listed on this page are ranked in the top twenty within the market and product category by total retail sales volume.

