Jun-2026
Sales
Trend
6-Month
Product Count
SKUs
Avg Price
YoY Sales Change
YoY Price Change
Market Insights Snapshot
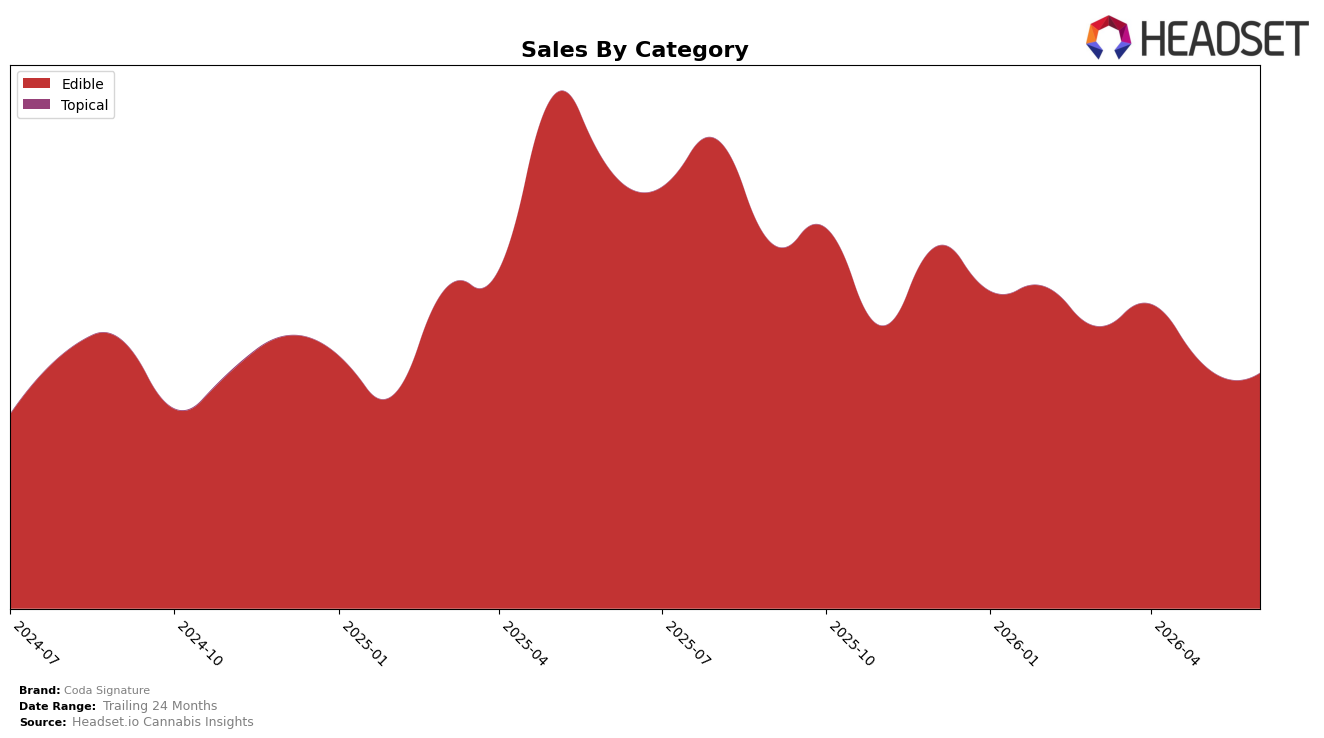
In June 2026, Coda Signature’s mix was concentrated entirely in Edible at 100.0% share, with category sales down 46.7% YoY and 3.0% MoM, while the average price softened 0.4% YoY; the brand held rank 16 in Edible in Colorado. The combination of a 100.0% single-category reliance and a two-step decline pattern (46.7% YoY alongside 3.0% MoM) implies exposure to category-specific headwinds rather than broad portfolio weakness, signaling that performance hinges on Edible cycle timing and that rank 16 leaves limited buffer if MoM erosion continues.
The shift toward a fully concentrated Edible strategy, paired with a slight 0.4% YoY price decrease and a 3.0% MoM sales dip, indicates that pricing adjustments are not offsetting volume drag, and rank 16 in Colorado places Coda Signature mid-pack. This pattern implies the brand’s positioning is tethered to Edible demand elasticity and promotional cadence: with 100.0% share in one category and a 46.7% YoY contraction, sustaining or improving rank will likely depend on regaining unit velocity rather than further price concessions.
Competitive Landscape
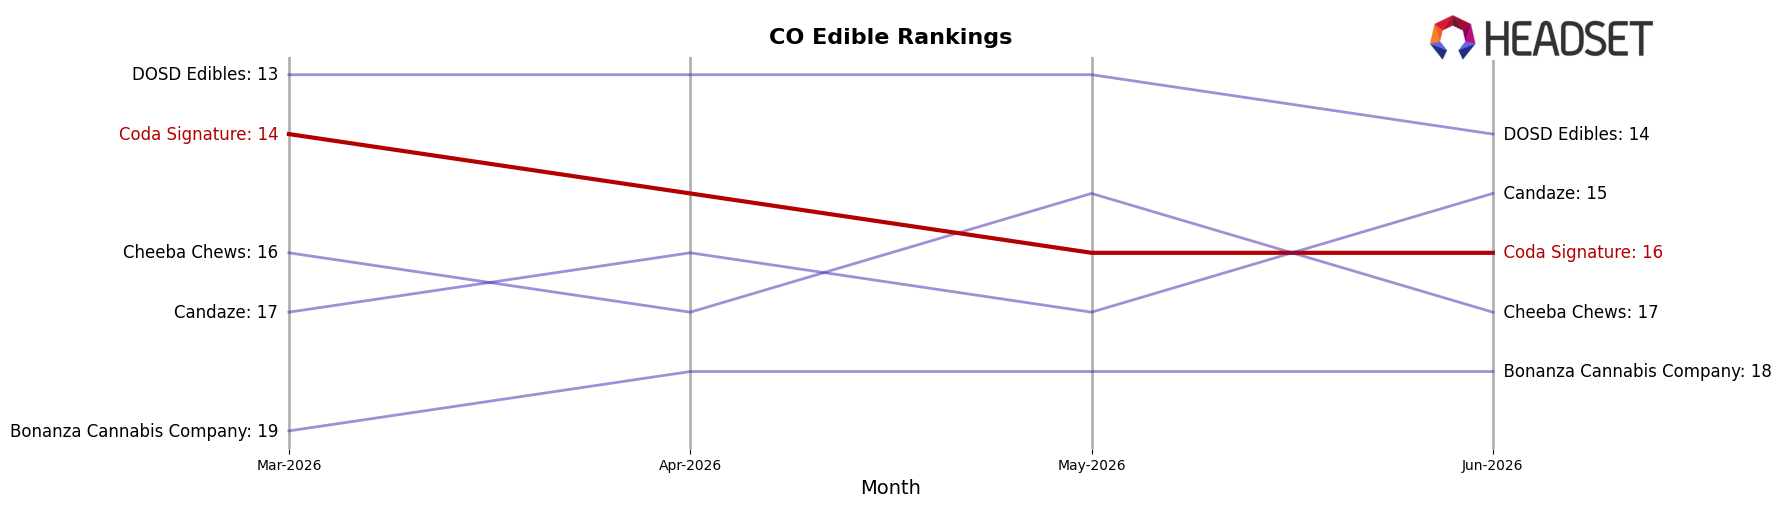
Coda Signature ranks #16 in Colorado Edible for June 2026, down 4 places year over year from #12 and 2 places since March 2026 from #14, while still trailing its peak of #10 from May 2025; in contrast, Wyld held #1 with a -16.6% YoY sales change and Wana maintained #2 with a -0.5% YoY shift, indicating that Coda Signature’s downward rank movement amid top-tier stability points to relative share loss versus leaders rather than a category-wide downturn, implying that reclaiming mid-tier positions will require outpacing peers that are either holding rank or softening less.
Notable Products
Passion Fruit & Guava Fast-Acting Fruit Notes 20-Pack (100mg) posted the steepest decline at -17.2% MoM and fell to rank 6, while Toffee & Sea Salt Chocolate Bar 20-Pack (100mg) slipped -9.0% to rank 3; this divergence indicates flavor innovation in fast-acting gummies is cooling as core chocolate bars consolidate share. In contrast, Coffee & Doughnuts Milk Chocolate Bar 20-Pack (100mg) rose +27.5% MoM to rank 1 and the CBD/THC 1:1 Coffee & Doughnuts Milk Chocolate Bar 20-Pack (100mg CBD, 100mg THC) climbed +36.0% to rank 2, with Edibles accounting for all top-10 SKUs and chocolate bars occupying at least five of the top six spots, signaling concentration around milk-chocolate formats. Cream & Crumble White Chocolate Bar 20-Pack (100mg) declined -4.5% at rank 5 while the CBD/THC 1:1 Cream & Crumble White Chocolate Bar 20-Pack (100mg CBD, 100mg THC) eased -4.3% at rank 6, suggesting limited cannibalization yet slower velocity for white-chocolate variants versus milk-chocolate leaders. The pattern implies Coda Signature is shifting commercial weight toward milk-chocolate bars and balanced 1:1 formulations as dependable volume anchors, while pulling back on fast-acting fruit SKUs that are not sustaining month-to-month momentum.
Top Selling Cannabis Brands
Data for this report comes from real-time sales reporting by participating cannabis retailers via their point-of-sale systems, which are linked up with Headset’s business intelligence software. Headset’s data is very reliable, as it comes digitally direct from our partner retailers. However, the potential does exist for misreporting in the instance of duplicates, incorrectly classified products, inaccurate entry of products into point-of-sale systems, or even simple human error at the point of purchase. Thus, there is a slight margin of error to consider. Brands listed on this page are ranked in the top twenty within the market and product category by total retail sales volume.

