.svg)

Sep-2026
Sales
Trend
6-Month
Product Count
SKUs
Avg Price
YoY Sales Change
YoY Price Change


Where to Buy
Binske is stocked at 285 licensed dispensaries across Colorado, Washington, and 5 other states, 150 of them in Colorado, with the deepest coverage in Denver, Colorado Springs, Aurora, Longmont, and Boulder. Search by ZIP code or city below to find the closest one, or filter by product type if you are after a specific format.
Market Insights Snapshot
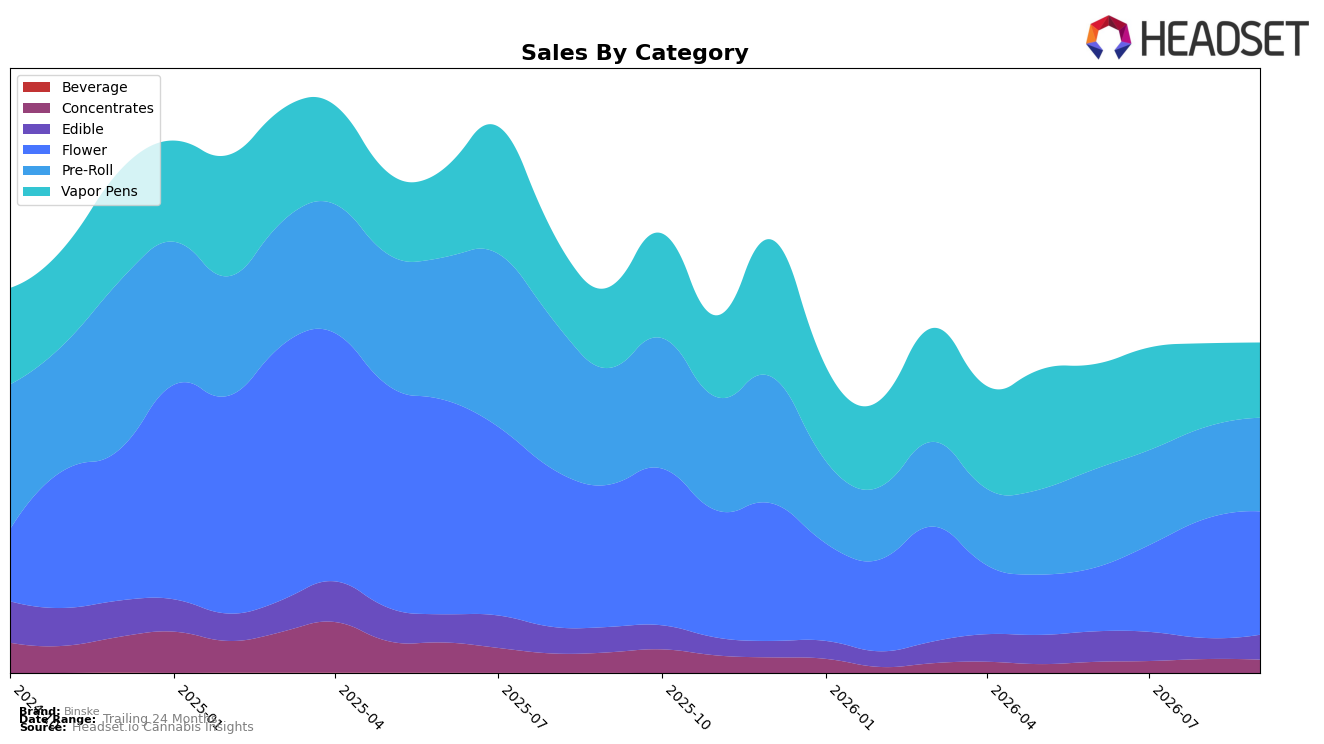
Binske’s category mix in September 2026 concentrated 37.35% of sales in Flower and 28.31% in Pre-Roll, with Vapor Pens at 22.77% and Edible at 7.50%. Year over year, Vapor Pens contracted a smaller 6.68% versus steeper drops of 13.26% in Flower and 19.84% in Pre-Roll, while Edible slipped only 2.04%; month over month, Edible rose 18.00% and Beverage increased 20.36% as Vapor Pens fell 10.46%. Average price declined 11.90% year over year to $26.71, while Flower pricing sat higher at $40.77 and Vapor Pens at $34.28, pointing to a mix that is leaning into lower-priced units even as Flower share remains the largest. With overall brand sales down 14.32% year over year and a 24‑month decline of 18.37%, the emerging pattern is a tilt toward value-oriented and smaller-ticket formats to stabilize volume while heavier revenue categories lag.
These shifts imply repositioning pressure: the faster month-over-month lift in Edible at 18.00% alongside a 10.46% Vapor Pens pullback suggests Binske is redistributing demand toward accessible price points rather than premium cart volume. In Michigan Flower, a rank of 80 combined with a 13.26% year-over-year category decline and only a 3.80% month-over-month uptick indicates limited headroom from the flagship category, and the 19.84% Pre-Roll contraction versus only 2.02% month-over-month improvement signals that quick wins are more likely in Edible and Beverage despite their 7.50% and 0.06% shares. The implication is that Binske’s near-term positioning will need to prioritize margin discipline and targeted depth in Edible and select value tiers while protecting Flower’s 37.35% share to prevent further rank erosion.
Competitive Landscape
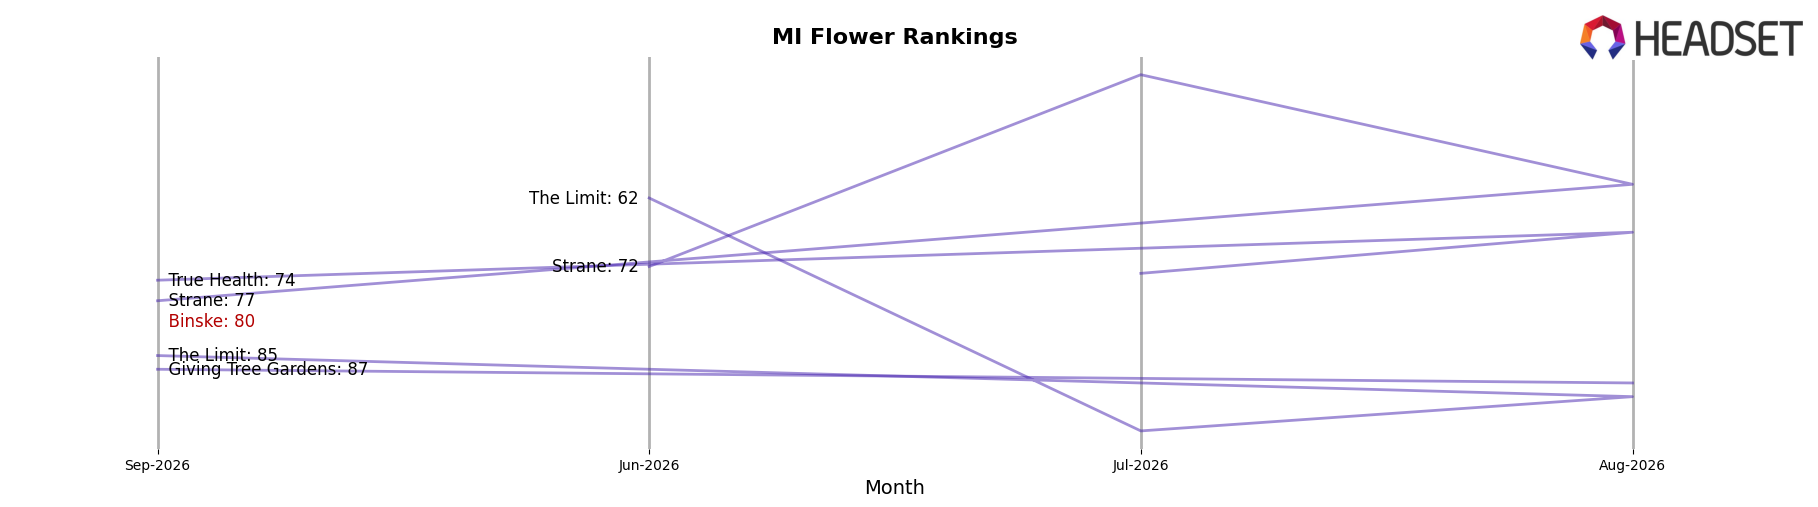
Binske sits at rank #80 in MI Flower in September 2026, improving 220 positions year over year from #300 and rising 115 spots since June 2026 from #195, but its current placement is far below leaders, as High Minded holds #1 with a -3.3% year-over-year sales change while Play Cannabis sits at #2 after climbing 5 ranks year over year from #7 alongside a 33.3% sales lift; in contrast, Binske’s peak rank is only now at #80 in September 2026, whereas NOBO advanced 15 ranks year over year from #19 to #4 with 188.3% sales growth and Pro Gro moved from #6 to #3 with 25.5% growth, indicating that Binske’s rapid rank recovery is catching up from a low base while category share consolidates among top-5 incumbents, implying that without multi-month acceleration beyond 100-rank gains, Binske’s trajectory points to sustained lower-tier positioning rather than imminent top-tier entry.
Notable Products
Tangerine Twist (Bulk) posted a 26.2% month-over-month gain to hold rank 1 in September 2026, while Mango Gummies 10-Pack (200mg) in rank 3 rose 6.8% in the same period. With Lemonberry Parfait Pre-Roll (1g) up 18.9% at rank 4 and three other Pre-Rolls sitting at ranks 5, 6, and 8, four of the top ten are Pre-Roll SKUs, indicating a tilt toward inhalables even as Flower anchors the top spot. The CBD/CBN/THC 1:1:2 Strawberry Guava Gummies 10-Pack (50mg CBD, 50mg CBN, 100mg THC) entered at rank 2 without a prior baseline and the Guava Live Resin Cartridge (1g) sits at rank 7, suggesting diversification alongside a single-category leader; Tangerine Twist (Bulk) generated $55,242. The pattern implies Binske is consolidating around a flagship Flower SKU while scaling Pre-Rolls as the second pillar, with Edibles and a Vapor Pen providing breadth rather than volume leadership.
Top Selling Cannabis Brands






Data for this report comes from real-time sales reporting by participating cannabis retailers via their point-of-sale systems, which are linked up with Headset’s business intelligence software. Headset’s data is very reliable, as it comes digitally direct from our partner retailers. However, the potential does exist for misreporting in the instance of duplicates, incorrectly classified products, inaccurate entry of products into point-of-sale systems, or even simple human error at the point of purchase. Thus, there is a slight margin of error to consider. Brands listed on this page are ranked in the top twenty within the market and product category by total retail sales volume.

