Jun-2026
Sales
Trend
6-Month
Product Count
SKUs
Avg Price
YoY Sales Change
YoY Price Change
Market Insights Snapshot
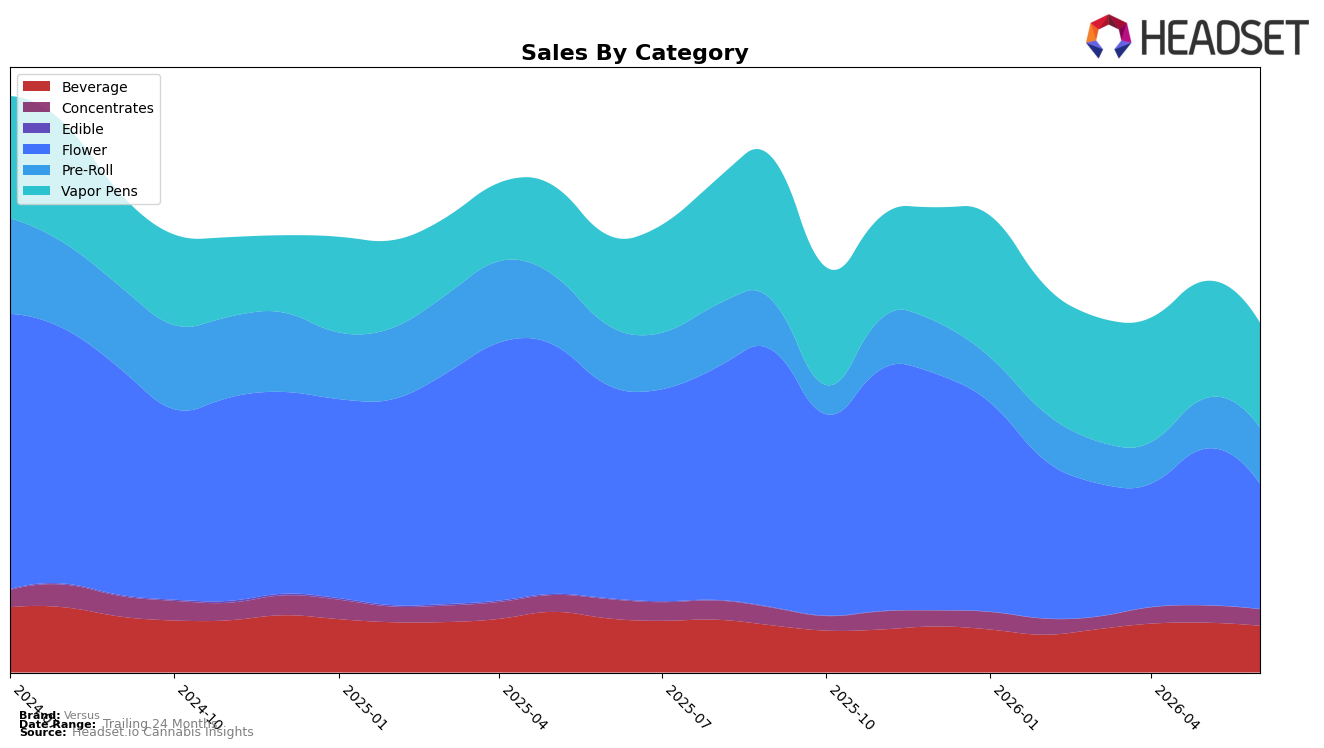
In June 2026, Versus concentrated 35.84% of sales in Flower and 30.06% in Vapor Pens, with Pre-Roll at 16.06% and Beverage at 13.35%, while Concentrates held 4.69% and Edible collapsed to 0.01%. Year over year, Flower fell 41.31% and Beverage declined 13.72%, contrasted by a 16.51% increase in Vapor Pens and a 6.28% decrease in Pre-Roll; month over month, Flower contracted 19.99% and Vapor Pens slipped 10.64% as Pre-Roll rose 11.65%. With brand-wide sales down 20.08% year over year and average price down 10.13%, the mix signals a pivot away from high-weight Flower toward inhalables where price elasticity is friendlier, implying Versus is trading volume from its legacy Flower base into Vapor Pens and Pre-Roll to stabilize share.
Versus sits at rank 9 in Flower in Saskatchewan, while its top market by sales remains ON, indicating geographic reliance on an Ontario-heavy footprint even as Flower softness persists. The 16.51% year-over-year gain in Vapor Pens alongside a 10.64% month-over-month dip, combined with an 11.65% month-over-month lift in Pre-Roll and a 19.99% month-over-month Flower decline, implies the brand’s near-term positioning leans into quick-turn inhalables to offset Flower attrition but requires steadier execution in Vapor Pens to avoid month-to-month volatility.
Competitive Landscape
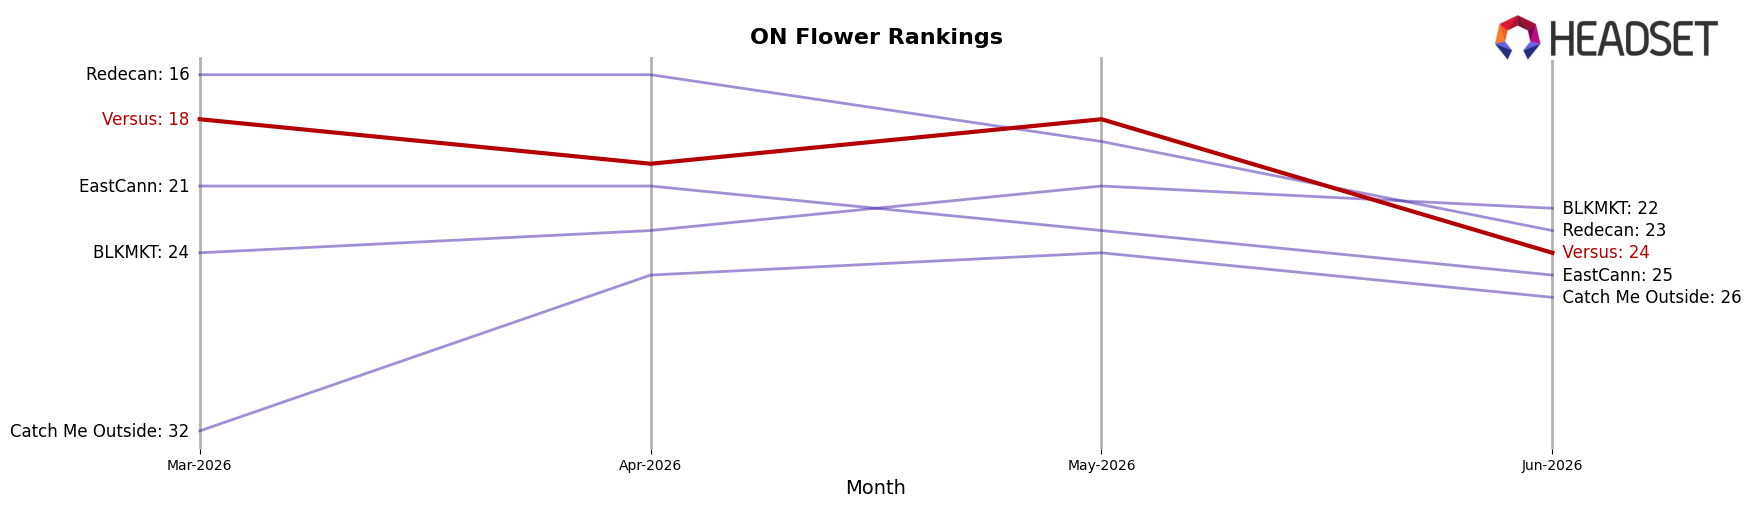
Versus is currently ranked #24 in ON Flower in June 2026, down 9 ranks year over year from #15, and 6 spots below its March 2026 position at #18; the brand also sits 17 places below its peak at #7 from June 2024, indicating a multi-period slide. In contrast, Spinach climbed from #4 to #1 with 38.28% YoY sales growth, while Shred rose from #2 to #2 in rank stability but added 18.48% YoY growth, widening the performance gap; meanwhile, Back Forty / Back 40 Cannabis fell from #1 to #4 with a -11.25% YoY sales change, yet still out-ranks Versus by 20 positions. The combination of a 9-rank YoY decline and a 6-rank drop versus three months ago implies Versus is ceding share to faster-growing leaders and needs a catalyst to halt continued rank erosion.
Notable Products
Neon Rush - Cali Blast Soda (10mg THC, 355ml) posted the steepest movement in June 2026 with a -30.6% MoM drop while sliding to rank 9, whereas CBD/THC 1:1 Neon Rush Carbonated Soda (10mg CBD, 10mg THC, 355ml) fell -8.0% yet held rank 1. Blueberry Pomegranate Rapid Seltzer (10mg THC, 350ml) rose +16.1% as the Beverage category occupied 7 of the top 10 ranks, indicating momentum concentrates in drinks despite mixed trajectories. Peach Dream Distillate Cartridge (1g) advanced +31.8% to rank 5 against a flat-to-declining soda set near ranks 1 and 4, with Beverage leaders still delivering the top-line anchor at $158,016. The pattern implies Versus is leaning into beverages for scale while vapor pens re-accelerate as a secondary growth engine that balances volatility in legacy sodas.
Top Selling Cannabis Brands
Data for this report comes from real-time sales reporting by participating cannabis retailers via their point-of-sale systems, which are linked up with Headset’s business intelligence software. Headset’s data is very reliable, as it comes digitally direct from our partner retailers. However, the potential does exist for misreporting in the instance of duplicates, incorrectly classified products, inaccurate entry of products into point-of-sale systems, or even simple human error at the point of purchase. Thus, there is a slight margin of error to consider. Brands listed on this page are ranked in the top twenty within the market and product category by total retail sales volume.

