.svg)

Aug-2026
Sales
Trend
6-Month
Product Count
SKUs
Avg Price
YoY Sales Change
YoY Price Change


Where to Buy
Craic is stocked at 20 licensed dispensaries across Connecticut, with the deepest coverage in Bristol, Manchester, Norwalk, Canton, and Hamden. Search by ZIP code or city below to find the closest one.
Market Insights Snapshot
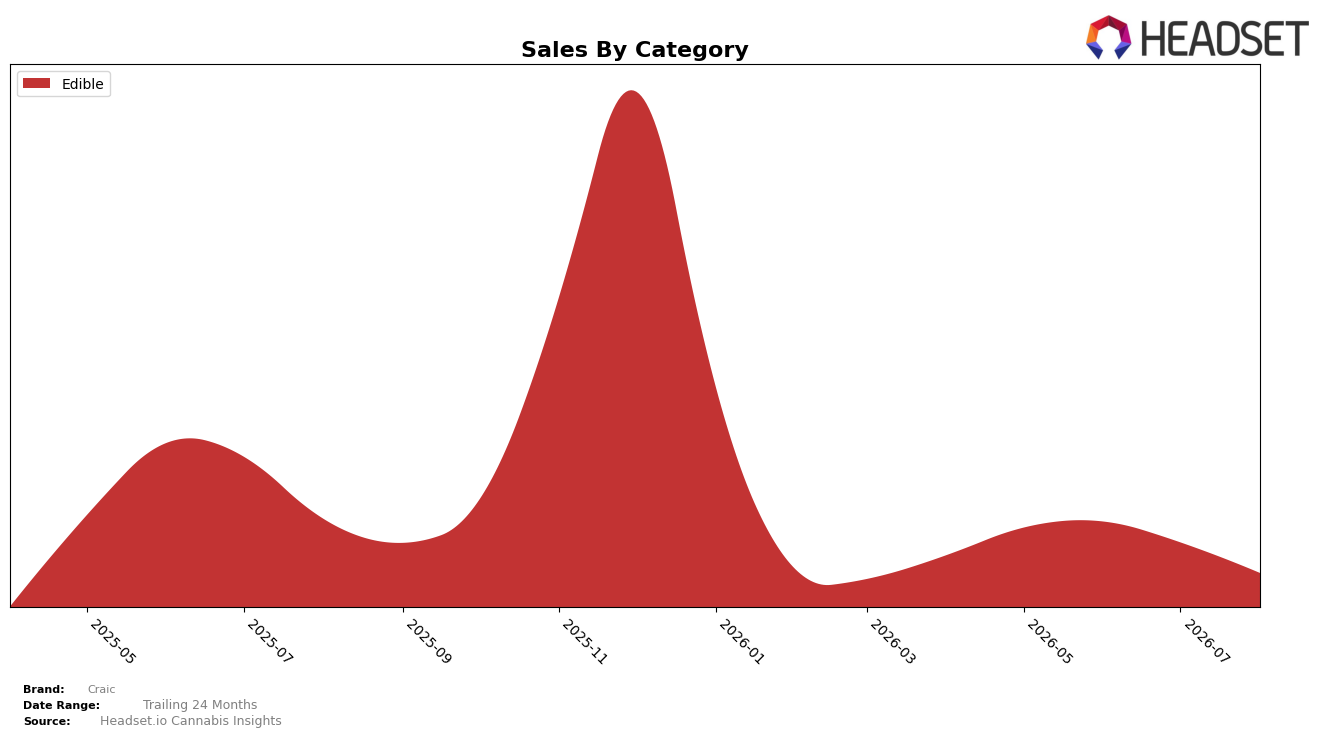
In August 2026, Craic operated as a single-category brand with Edible accounting for 100.0% of sales, while year-over-year sales fell 57.38% and month-over-month sales declined 43.11%. Average price decreased 11.18% year over year to $19.81, which, paired with a 100.0% category concentration, indicates that unit volume did not offset price compression. With no diversification beyond Edible and rank data unavailable in Connecticut, the combination of a 57.38% YoY contraction and a 43.11% MoM step-down implies overexposure to a weakening Edible lane rather than a broad portfolio issue.
The sharper 43.11% month-over-month drop versus the 11.18% YoY price cut suggests demand elasticity and seasonality are pressuring throughput more than pricing can stimulate, while the 100.0% Edible mix concentrates this risk. Given that August 2026 carried a larger short-term decline than the annual price movement, Craic’s positioning skews toward price-taking in Edible rather than differentiation, and the lack of cross-category buffers implies that stabilization will depend on mix shifts or subsegment targeting within Edible rather than incremental price moves.
Competitive Landscape
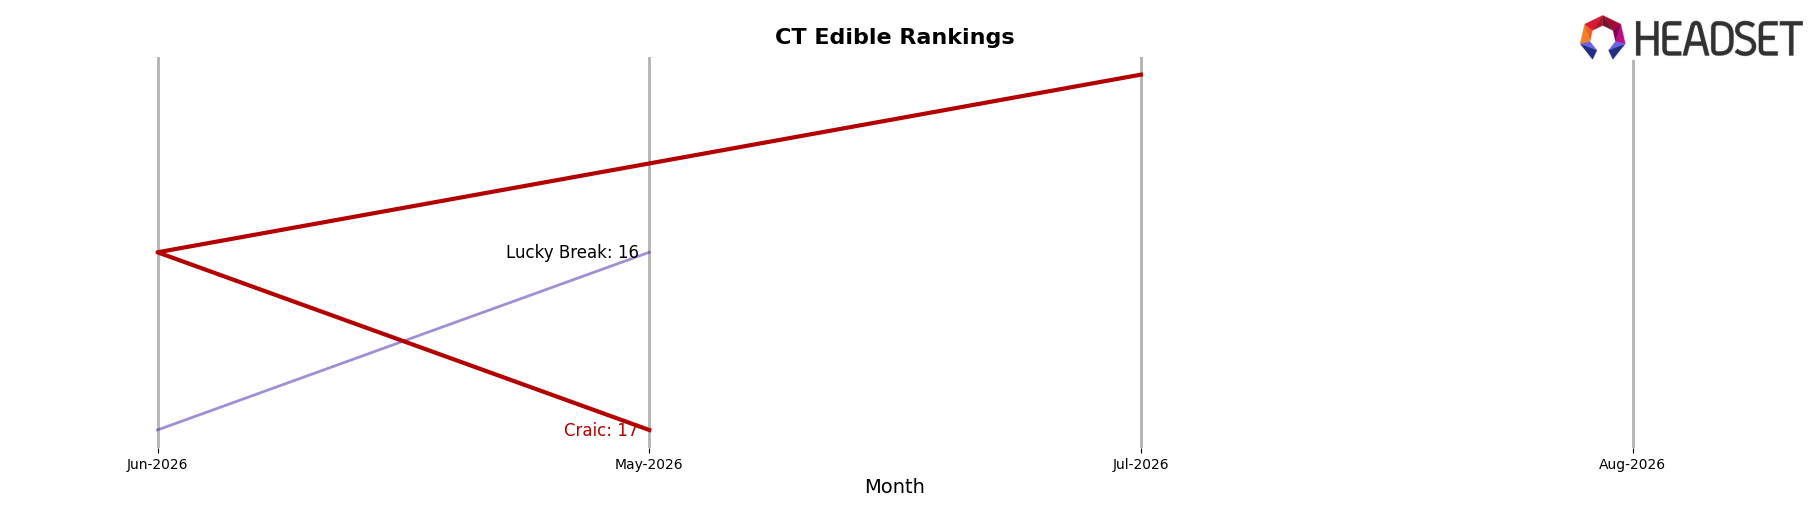
Craic ranks #20 in CT Edible in August 2026, down 3 positions year over year from #17, and flat versus three months ago at #17 to #20, while the category leaders moved in the opposite direction: Soundview rose from #2 to #1 with sales up 4.1% year over year and Asteroid Cannabis surged from #13 to #5 alongside a 736.1% year-over-year sales increase; in contrast, Encore Edibles fell from #1 to #4 with sales down 56.5%, indicating that Craic’s slide from its December 2025 peak rank of #11 to #20 in August 2026, despite volatility among peers, points to lost relative momentum that will require either distribution gains or pricing moves to arrest further share erosion.
Notable Products
Dark Chocolate 20-Pack (100mg) posted the sharpest movement in August 2026 with a -80.8% month-over-month drop while holding rank 3, a steeper decline than Milk Chocolate 20-Pack (100mg) at -54.4% and rank 4. Milk Chocolate Squares 10-Pack (100mg) stayed at rank 1 despite a -30.3% slide, whereas Dark Chocolate Squares 10-Pack (100mg) rose +35.0% at rank 2; three of the top four SKUs are Edibles, concentrating category exposure. The single-pack formats now anchor the top two ranks as both 20-Packs contract, implying a shift in buyer preference toward smaller pack sizes and a need to rebalance assortment and pricing toward 10-Packs.
Top Selling Cannabis Brands






Data for this report comes from real-time sales reporting by participating cannabis retailers via their point-of-sale systems, which are linked up with Headset’s business intelligence software. Headset’s data is very reliable, as it comes digitally direct from our partner retailers. However, the potential does exist for misreporting in the instance of duplicates, incorrectly classified products, inaccurate entry of products into point-of-sale systems, or even simple human error at the point of purchase. Thus, there is a slight margin of error to consider. Brands listed on this page are ranked in the top twenty within the market and product category by total retail sales volume.

