Jun-2026
Sales
Trend
6-Month
Product Count
SKUs
Avg Price
YoY Sales Change
YoY Price Change
Market Insights Snapshot
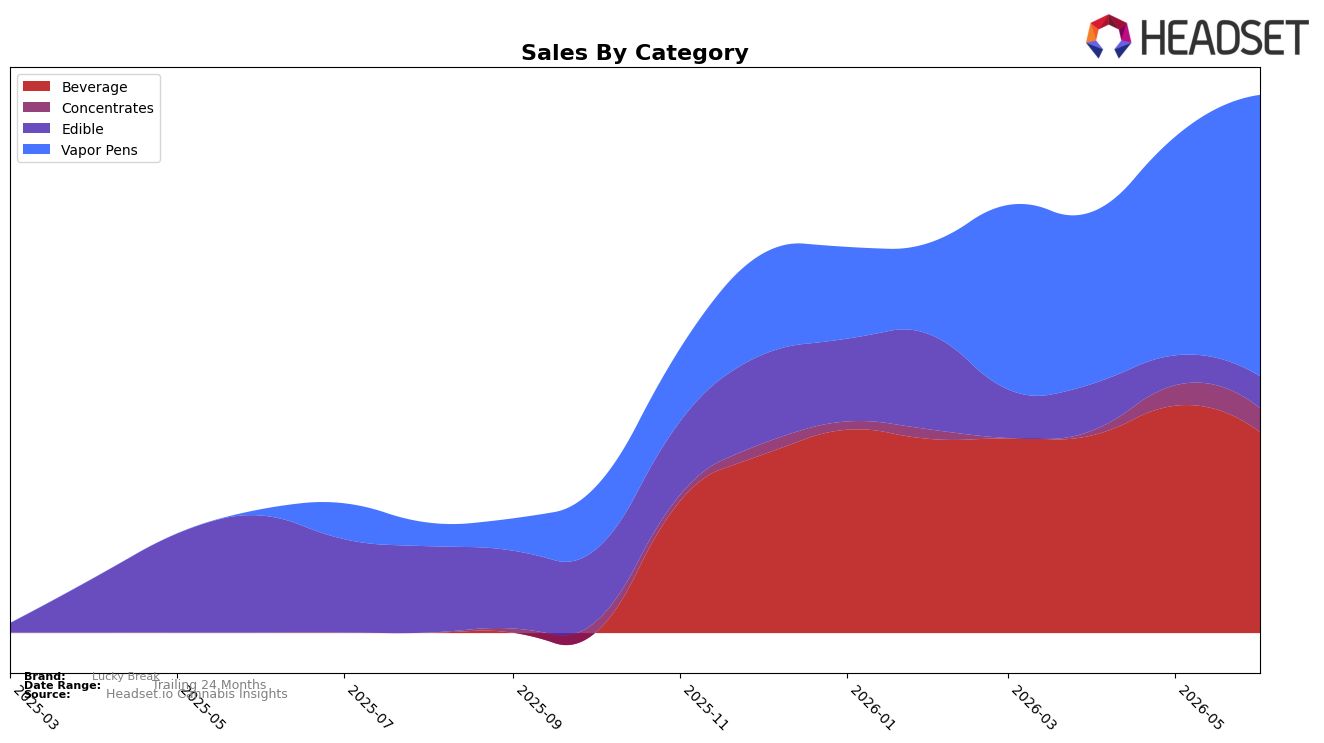
Lucky Break’s mix in June 2026 is anchored by Vapor Pens at 52.32% share with a 4,404.64% year-over-year surge and 28.65% month-over-month growth, while Beverage holds 37.38% share with a -11.60% month-over-month decline and no year-over-year baseline, and Edible sits at 5.90% share with -72.85% year-over-year and 6.88% month-over-month moves. Concentrates contributes 4.41% share with 17.33% month-over-month growth and no year-over-year baseline, and the brand’s Vapor Pens rank is 16 in Connecticut, indicating mid-pack placement as average price fell 48.89% year over year alongside total brand sales up 336.97% year over year. The pattern implies Lucky Break is consolidating around inhalables while de-prioritizing legacy edibles, using price compression to accelerate volume in Vapor Pens and tolerating Beverage volatility to fund growth in a category where a rank of 16 can still gain share.
With Vapor Pens expanding share to a majority at 52.32% and posting 28.65% month-over-month growth as Beverage contracts month over month by 11.60%, the portfolio is tilting toward faster-turn SKUs where a 48.89% year-over-year price decrease can translate into outsized unit gains. Edible’s -72.85% year-over-year decline versus a modest 6.88% month-over-month uptick, combined with Concentrates’ 17.33% month-over-month rise off a 4.41% share, suggests a shift toward potency-led and convenience-led formats that can climb from a rank of 16 in Connecticut if price-pack architecture continues to prioritize accessible entry points and cross-format trade-up paths. The implication is that sustained share gains will come from defending Vapor Pens velocity while selectively nurturing Concentrates as a margin counterweight, rather than reallocating back to Beverage or Edible near term.
Competitive Landscape
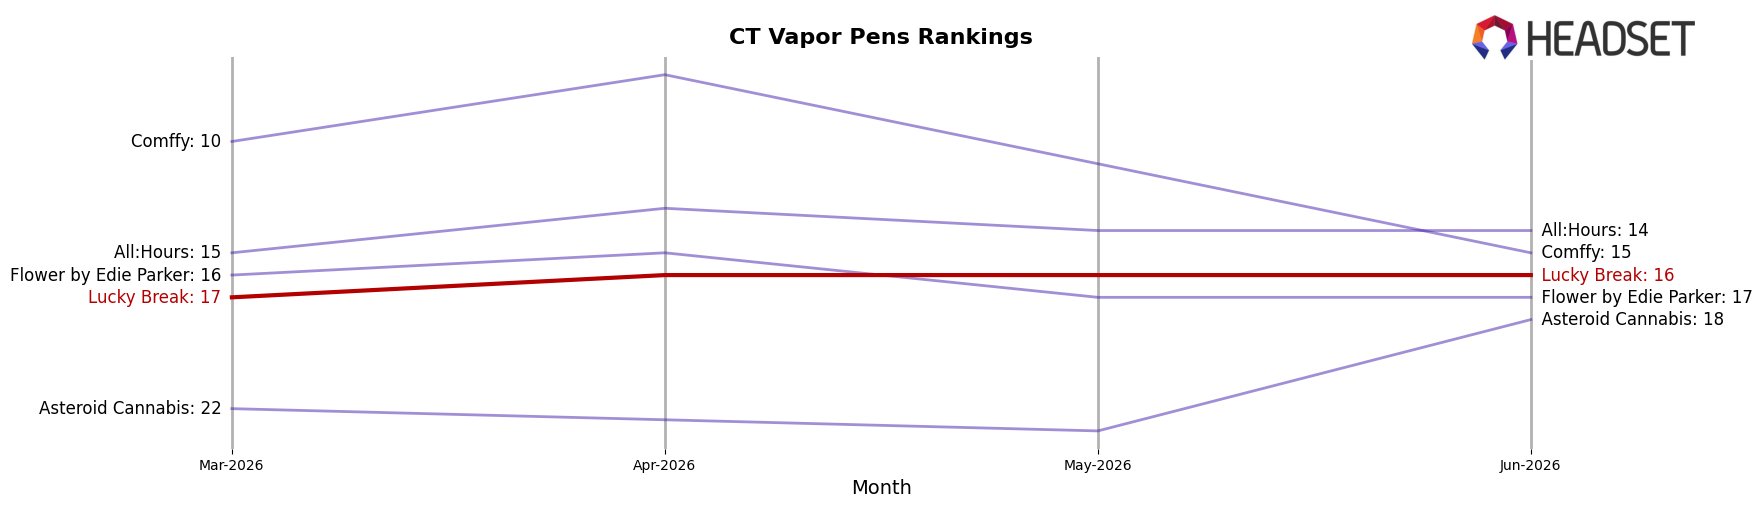
Lucky Break sits at rank #16 in CT Vapor Pens in June 2026, with a 0-position year-over-year change from June 2025 and a 1-position climb from #17 in March 2026, marking a new peak at #16 in June 2026. In contrast, Select moved from #4 to #1 with 72.5% YoY sales growth, while Theraplant slipped from #1 to #3 alongside a 50.4% YoY sales decline, indicating that category leadership is rotating even as Lucky Break’s rank remains static. The combination of zero YoY rank movement and a modest 1-rank improvement over three months implies a stable position that is not yet translating into upward share capture amid faster shifts among leaders.
Notable Products
White Widow Live Resin Disposable (0.5g) posted the largest movement in June 2026 with an 88% month-over-month surge into rank 7, while Watermelon Kush Live Resin Disposable (0.5g) and Acapulco Gold Live Resin Disposable (0.5g) climbed 72% and 68% to ranks 5 and 6, respectively. In contrast, Blueberry Lemonade Elixir (95mg, 2oz, 59ml) fell 26% to rank 9, and Blueberry Lemonade Fast Acting Elixir (95mg, 2oz, 59ml) slipped 9% at rank 3, signaling share leakage from Beverage into Vapor Pens where four of the top ten are Vapor Pens. Maui Wowie Live Resin Disposable (0.5g) held rank 1 with a 3% lift and $49,431 in sales, while Fast Acting Lucky Honey (100mg) rose 57% at rank 8, indicating ancillary Edibles can ride the same momentum that is boosting pen SKUs. The pattern implies Lucky Break’s commercial direction is tilting toward Live Resin Vapor Pens as the growth engine, with Beverage SKUs providing scale but ceding rank to faster-accelerating inhalables.
Top Selling Cannabis Brands
Data for this report comes from real-time sales reporting by participating cannabis retailers via their point-of-sale systems, which are linked up with Headset’s business intelligence software. Headset’s data is very reliable, as it comes digitally direct from our partner retailers. However, the potential does exist for misreporting in the instance of duplicates, incorrectly classified products, inaccurate entry of products into point-of-sale systems, or even simple human error at the point of purchase. Thus, there is a slight margin of error to consider. Brands listed on this page are ranked in the top twenty within the market and product category by total retail sales volume.

