.svg)

Aug-2026
Sales
Trend
6-Month
Product Count
SKUs
Avg Price
YoY Sales Change
YoY Price Change



Where to Buy
Affinity Grow is stocked at 44 licensed dispensaries across Connecticut, with the deepest coverage in New Haven, Norwalk, West Hartford, Danbury, and Hamden. Search by ZIP code or city below to find the closest one, or filter by product type if you are after a specific format.
Market Insights Snapshot
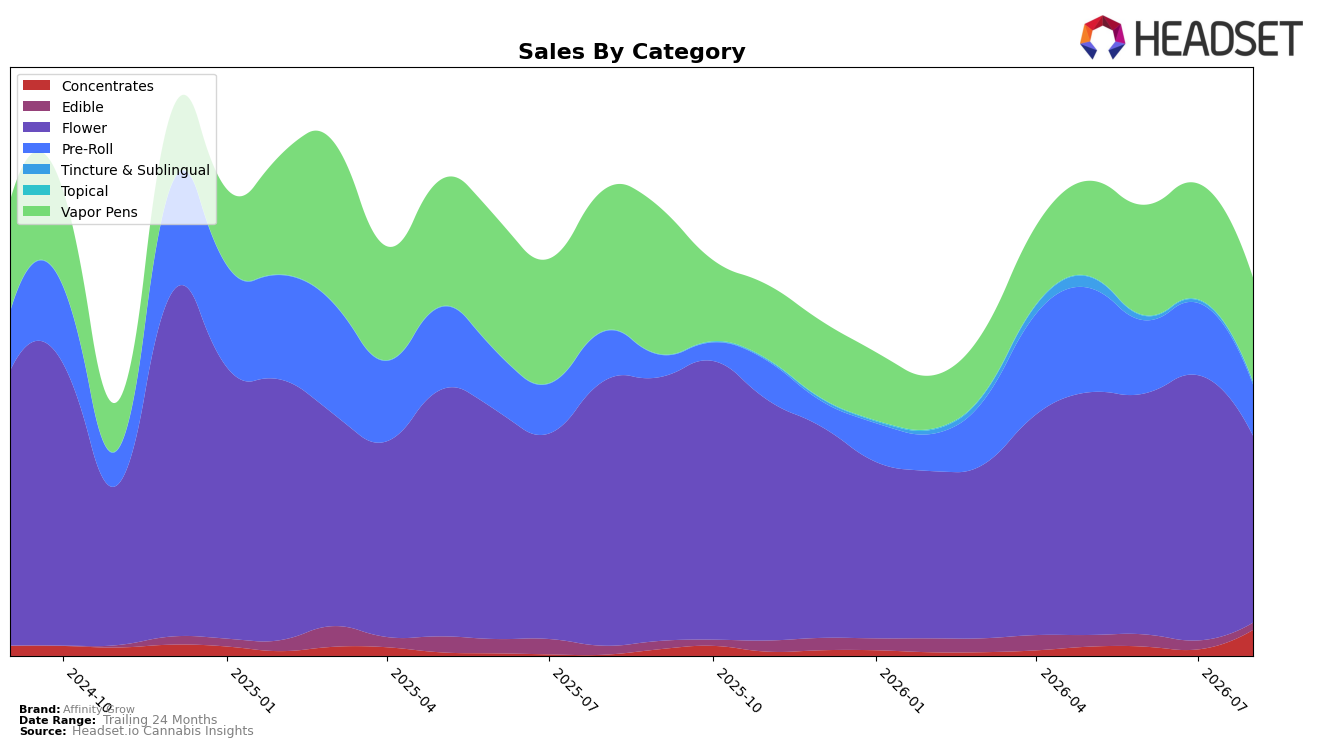
Affinity Grow’s mix in August 2026 concentrated 49.5% of sales in Flower while placing rank 6 in Connecticut Flower, yet Flower fell 29.9% month over month and 29.9% year over year, dragging overall sales down 19.3% YoY. Vapor Pens held 27.5% share but declined 10.7% MoM and 26.9% YoY, whereas Pre-Roll at 13.5% share slipped 29.6% MoM but inched up 3.3% YoY. The outlier was Concentrates at 6.9% share, up 315.5% MoM and 2,757.4% YoY, alongside modest average price inflation of 3.0% YoY to $30.71. The pattern implies a pivot away from shrinking core inhalables toward a fast-scaling Concentrates line that is not yet large enough to offset Flower and Vapor Pens contractions, keeping category reliance concentrated despite share churn.
Given Flower’s 49.5% share and 29.9% MoM drop versus Concentrates’ 6.9% share and 315.5% MoM surge, the brand’s risk profile is tied to a weakening primary category while growth is accruing in a smaller niche. With Vapor Pens down 26.9% YoY and Pre-Roll up 3.3% YoY but down 29.6% MoM, the short-term trajectory points to volatility across inhalables rather than stable substitution. Holding rank 6 in Connecticut Flower while average prices rose 3.0% YoY suggests pricing is not the main lever; instead, mix realignment is the lever, and the implication is that scaling Concentrates and stabilizing Pre-Roll penetration are the most direct paths to buffer core-category drawdown and reduce dependence on a single rank-constrained segment.
Competitive Landscape
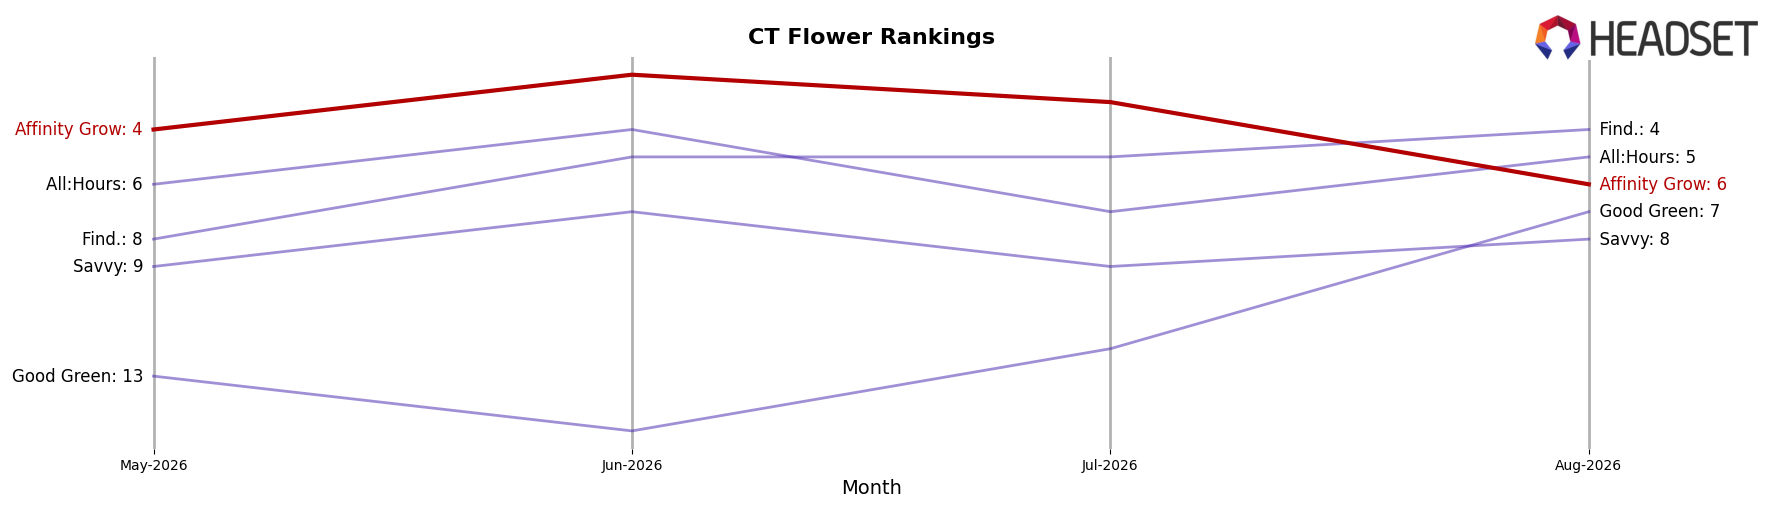
Affinity Grow sits at rank #6 in CT Flower in August 2026, down 1 position year over year from #5, and off 2 positions from May–June momentum when it peaked at #2 in June 2026; by contrast, Theraplant climbed to #1 from #8 year over year while growing sales 85.2%, and Find. moved to #4 from #13 with 167.3% YoY sales growth, indicating competitors are accelerating faster than Affinity Grow’s slide from #4 three months ago to #6 now; with All:Hours at #5 after rising from #9 and Comffy holding #3 versus #7 a year ago on 23.4% YoY growth, the pattern implies Affinity Grow’s rank trajectory is drifting downward as faster-gaining peers compress share above and below its position.
Notable Products
Sunshine Daydream (3.5g) posted the steepest movement in August 2026 with a -55.9% month-over-month drop while sliding to rank 3, contrasting with The Duke (3.5g) inching up 4.0% at rank 5. Capy (3.5g) held rank 1 despite no reported month-over-month figure, and Lemon Delight Pre-Roll 3-Pack (2.1g) stayed near flat at -0.8% in rank 6. With four of the top ten in Flower and two in Pre-Roll, the mix tilts toward inhalables where volatility in a single Flower SKU can quickly reshape share, implying Affinity Grow’s near-term direction hinges on stabilizing flagship Flower while nurturing steady Pre-Roll velocity.
Top Selling Cannabis Brands






Data for this report comes from real-time sales reporting by participating cannabis retailers via their point-of-sale systems, which are linked up with Headset’s business intelligence software. Headset’s data is very reliable, as it comes digitally direct from our partner retailers. However, the potential does exist for misreporting in the instance of duplicates, incorrectly classified products, inaccurate entry of products into point-of-sale systems, or even simple human error at the point of purchase. Thus, there is a slight margin of error to consider. Brands listed on this page are ranked in the top twenty within the market and product category by total retail sales volume.

