.svg)

Aug-2026
Sales
Trend
6-Month
Product Count
SKUs
Avg Price
YoY Sales Change
YoY Price Change


Where to Buy
Creme De Canna is stocked at 98 licensed dispensaries across California, with the deepest coverage in Sacramento, San Francisco, Los Angeles, San Jose, and Santa Rosa. Search by ZIP code or city below to find the closest one, or filter by product type if you are after a specific format.
Market Insights Snapshot
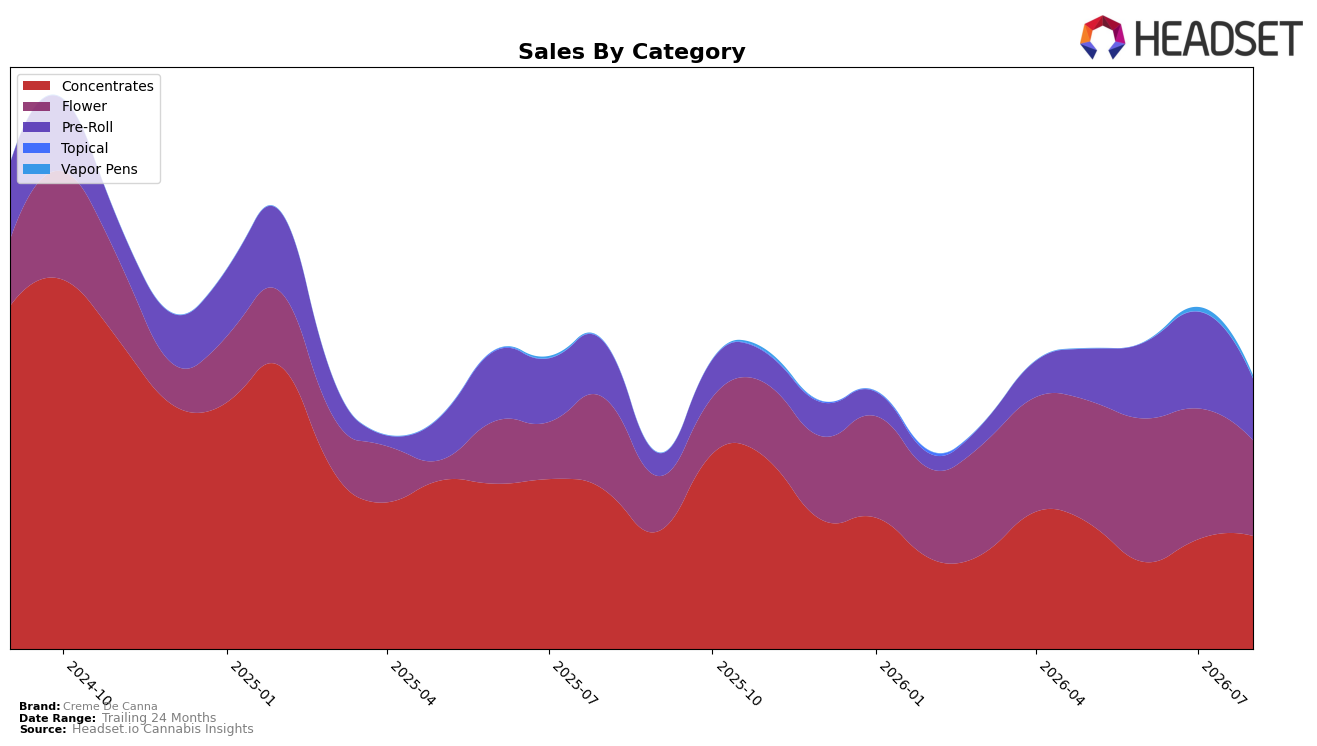
Creme De Canna concentrated its sales in Concentrates at 41.48% share (rank 40 in California Concentrates), while Flower accounted for 35.02% and Pre-Roll 22.55%. Year over year in August 2026, Concentrates declined 29.04% while Flower grew 4.08% and Pre-Roll grew 10.66%; month over month, Concentrates rose 3.14% but Flower fell 27.03% and Pre-Roll fell 36.43%. With brand sales down 11.17% year over year alongside a 9.56% increase in average price, the pattern implies a mix tilting toward higher-priced Flower and Pre-Roll on a yearly basis but with sharp monthly pullbacks that leave the brand overexposed to Concentrates volatility.
The shifts suggest positioning anchored in value-driven Concentrates (average price $14.25) with partial offset from premium-priced Flower at $27.73 and Pre-Roll at $26.22; the category split of 41.48% vs. 35.02% creates sensitivity to category rank at 40 and to California demand cycles. Given 24-month sales down 45.15% and Vapor Pens at only 0.96% share with a 34.74% monthly decline, the mix implies limited insulation against category downturns; sustaining the slight 3.14% monthly lift in Concentrates while reversing the 27.03% and 36.43% monthly drops in Flower and Pre-Roll would reposition the brand toward steadier share rather than price-led contraction.
Competitive Landscape
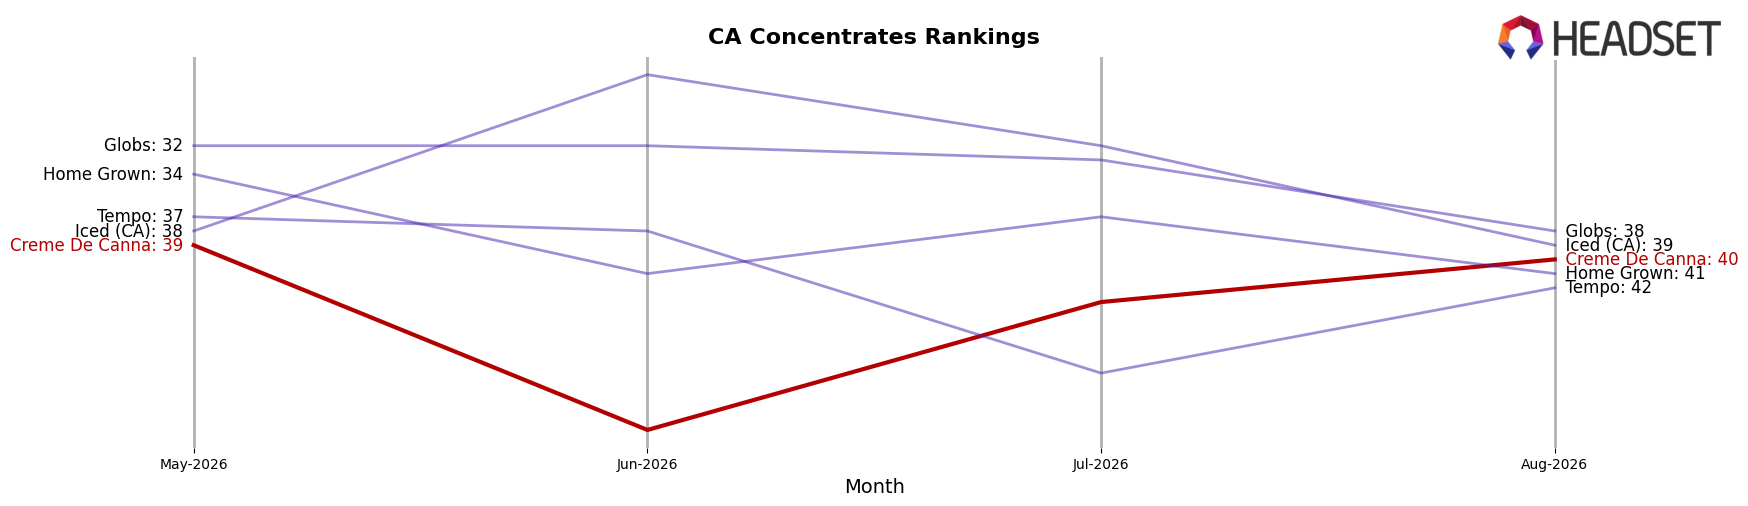
Creme De Canna sits at rank #40 in CA Concentrates in August 2026, down 6 spots year over year from #34 and slipping 1 position versus May 2026’s #39, while still far from its peak rank of #13 in October 2024; meanwhile, Raw Garden held #1 year over year with a 9.9% YoY sales increase as 710 Labs advanced from #4 to #2 on 33.5% YoY growth, and STIIIZY eased from #2 to #3 with a 2.3% YoY sales decline, indicating Creme De Canna is losing relative share as faster-growing leaders consolidate top-5 positions and its downward rank trajectory implies continued shelf pressure unless mix or velocity shifts reverse the slide.
Notable Products
Peach Flambe Diamond Sugar (1g) posted the steepest pullback at -6.9% month over month while sliding to rank 3, whereas Odder Popz Diamond Sugar (1g) climbed 36.0% to hold rank 1. Strawberry Daiquiri Diamond & Crumble Infused Flower (3.5g) advanced 39.3% to rank 2, outpacing Sweet Tooth Diamond Sauce (1g) at a modest 3.5% gain and shared rank 7. Six of the top ten are Concentrates, and two of the top three are Diamond Sugar SKUs, signaling a tilt toward extract-driven velocity that concentrates demand at the top of the leaderboard.
OG Kush Diamond & Crumble Infused (3.5g) held rank 5 with no reported month-over-month figure, while Pineapple Whip Infused Flower (3.5g) sat at rank 9 with $8,484 in sales and no MoM change provided. Grape Ape Diamond Badder (1g) occupied rank 4 without a recorded MoM rate, while Diamond Dawg OG Cold Cure Diamond Sugar (1g) and Double Tropicana Diamond Sugar (1g) followed at ranks 6 and 7, respectively. The concentration of Diamond-form extracts in ranks 1, 3, 4, 6, 7, and 8 indicates a product mix skewing toward premium texture SKUs, implying near-term merchandising should prioritize Diamond Sugar and Badder variants over broader flower expansion.
Top Selling Cannabis Brands






Data for this report comes from real-time sales reporting by participating cannabis retailers via their point-of-sale systems, which are linked up with Headset’s business intelligence software. Headset’s data is very reliable, as it comes digitally direct from our partner retailers. However, the potential does exist for misreporting in the instance of duplicates, incorrectly classified products, inaccurate entry of products into point-of-sale systems, or even simple human error at the point of purchase. Thus, there is a slight margin of error to consider. Brands listed on this page are ranked in the top twenty within the market and product category by total retail sales volume.

