.svg)
Aug-2026
Sales
Trend
6-Month
Product Count
SKUs
Avg Price
YoY Sales Change
YoY Price Change


Where to Buy
Casual Cannabis is stocked at 145 licensed dispensaries across California, with the deepest coverage in Los Angeles, San Francisco, Costa Mesa, Lake Elsinore, and Long Beach. Search by ZIP code or city below to find the closest one.
Market Insights Snapshot
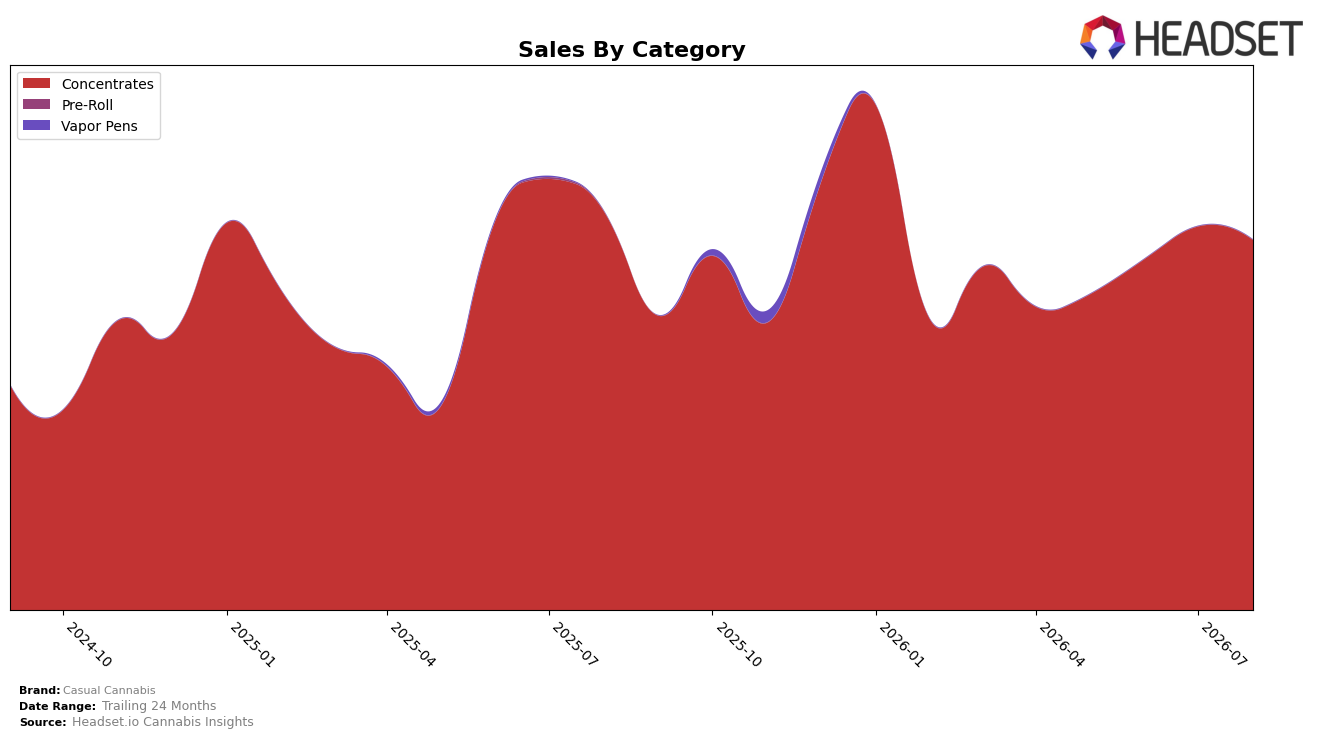
In August 2026, Casual Cannabis operated as a single-category brand with Concentrates representing 100.0% of sales, while category sales declined 7.17% year over year and 3.54% month over month. The brand’s overall sales fell 7.24% year over year alongside a 1.85% average price decrease, and it held rank 23 in Concentrates in California. The pattern implies a volume-led contraction within a concentrated portfolio, where price cuts did not offset demand softness and a sole-category focus amplified exposure to category-level declines.
With Concentrates at 100.0% mix and rank 23 in the California Concentrates set, the 7.17% year-over-year and 3.54% month-over-month dips signal vulnerability to single-category swings rather than cross-category balance. The 1.85% price reduction alongside a 7.24% sales decline suggests limited elasticity capture, implying that near-term positioning hinges on defending share within Concentrates while considering selective diversification to reduce rank risk if category softness persists.
Competitive Landscape
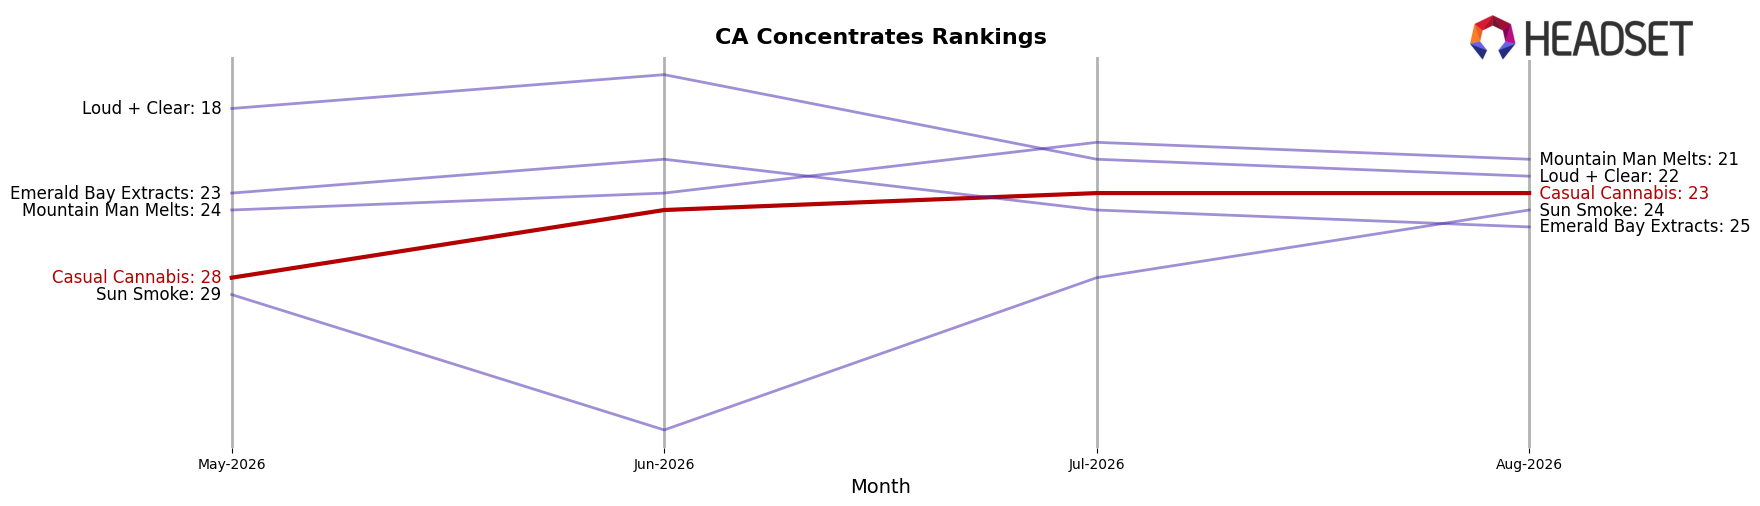
Casual Cannabis sits at rank 23 in CA Concentrates in August 2026, unchanged year over year at 23 but improving 5 positions from May 2026’s rank 28, while still trailing its January 2026 peak rank 20 by 3 spots; in contrast, 710 Labs climbed from rank 4 to rank 2 and STIIIZY slipped from rank 2 to rank 3, indicating upward mobility is available even among top-three incumbents, and the flat YoY rank alongside a 5-rank gain over three months implies Casual Cannabis is stabilizing near the low-20s with incremental momentum rather than breaking into the teens without a sharper share shift.
Notable Products
Casual x Potwest - Blue Amaretto Badder (1g) posted the steepest movement in August 2026 with a -31.1% month-over-month decline while sitting at rank 8, and Sunset Haze Badder (1g) followed with a -28.1% drop at rank 7. At the top, Grapefruit Sherb Badder (1g) held rank 1 despite a -2.2% slide, while Afghan Chem Badder (1g) fell -24.1% at rank 3, indicating pressure in the middle of the leaderboard. With all ten top SKUs concentrated in Concentrates and two products sharing rank 4, the rank clustering alongside multiple double-digit declines points to saturation risk and a need to rotate novelty within the badder lineup to stabilize share.
Top Selling Cannabis Brands






Data for this report comes from real-time sales reporting by participating cannabis retailers via their point-of-sale systems, which are linked up with Headset’s business intelligence software. Headset’s data is very reliable, as it comes digitally direct from our partner retailers. However, the potential does exist for misreporting in the instance of duplicates, incorrectly classified products, inaccurate entry of products into point-of-sale systems, or even simple human error at the point of purchase. Thus, there is a slight margin of error to consider. Brands listed on this page are ranked in the top twenty within the market and product category by total retail sales volume.

