May-2026
Sales
Trend
6-Month
Product Count
SKUs
Avg Price
YoY Sales Change
YoY Price Change
Market Insights Snapshot
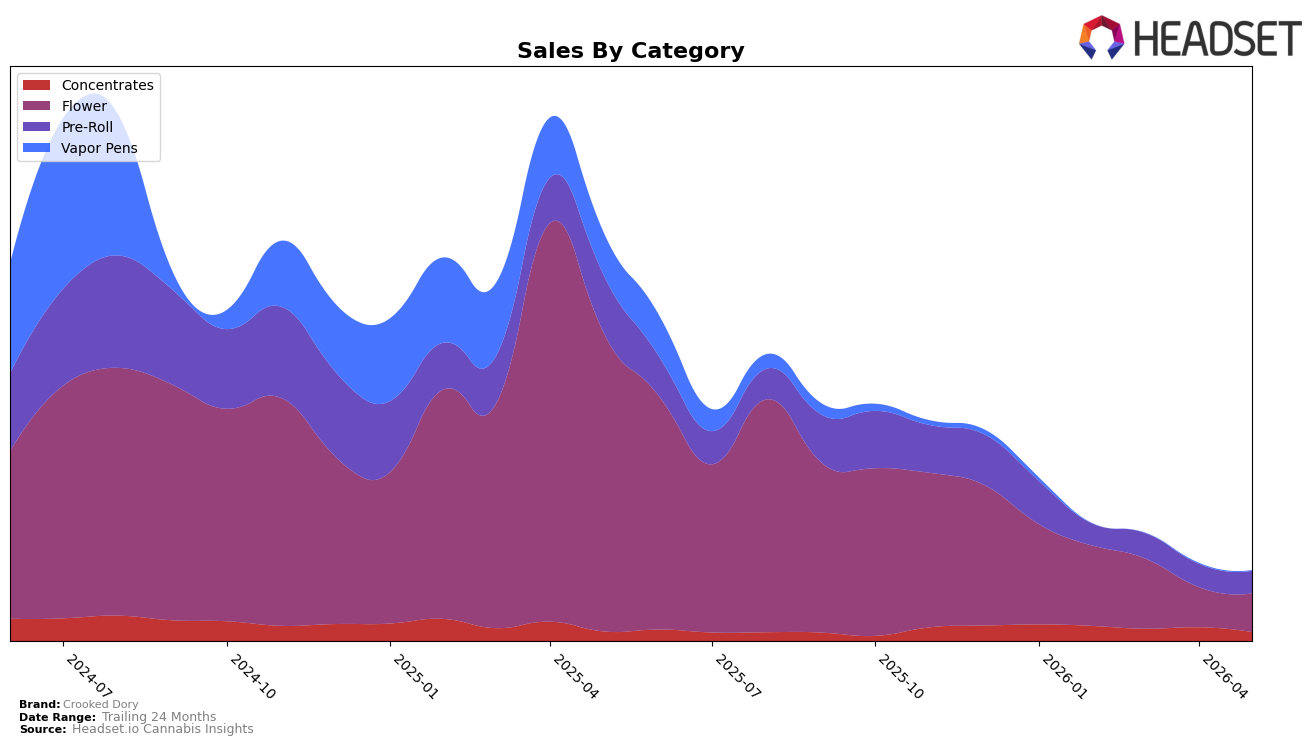
In May 2026, Crooked Dory’s mix concentrated in Flower at 54.71% share with year-over-year decline of 87.20% and month-over-month decline of 4.08%, while Pre-Roll held 31.90% share with year-over-year decline of 61.24% and month-over-month decline of 3.05%. Concentrates accounted for 12.93% share with a smaller year-over-year decline of 6.50% but a sharper month-over-month decline of 34.60%, and Vapor Pens fell to 0.46% share with a year-over-year decline of 99.23% and month-over-month decline of 46.86%. The brand’s average price moved down 25.96% year over year to $43.91, while overall brand sales declined 82.88% year over year, and in Ontario the top category remains Flower with no rank reported; the pattern implies a portfolio anchored in a rapidly contracting Flower base and a collapsing Vapor Pens presence that is not being offset by Pre-Roll or Concentrates month to month.
The divergence between Concentrates’ relatively modest 6.50% year-over-year decline and its 34.60% month-over-month drop, alongside Flower’s 87.20% year-over-year decline but only 4.08% month-over-month erosion, signals recent share instability favoring short-term retrenchment rather than sustained replacement of the core category. With Vapor Pens at 0.46% share and down 46.86% month over month versus Pre-Roll down 3.05% month over month at 31.90% share, the mix implies Crooked Dory is positioned as a Flower–Pre-Roll brand with waning adjacency in inhalable formats; the price cut of 25.96% year over year against an 82.88% sales decline indicates that discounting is not shifting category momentum, pointing to a need to reallocate emphasis toward the categories where month-over-month declines are smallest if the goal is near-term stabilization.
Competitive Landscape
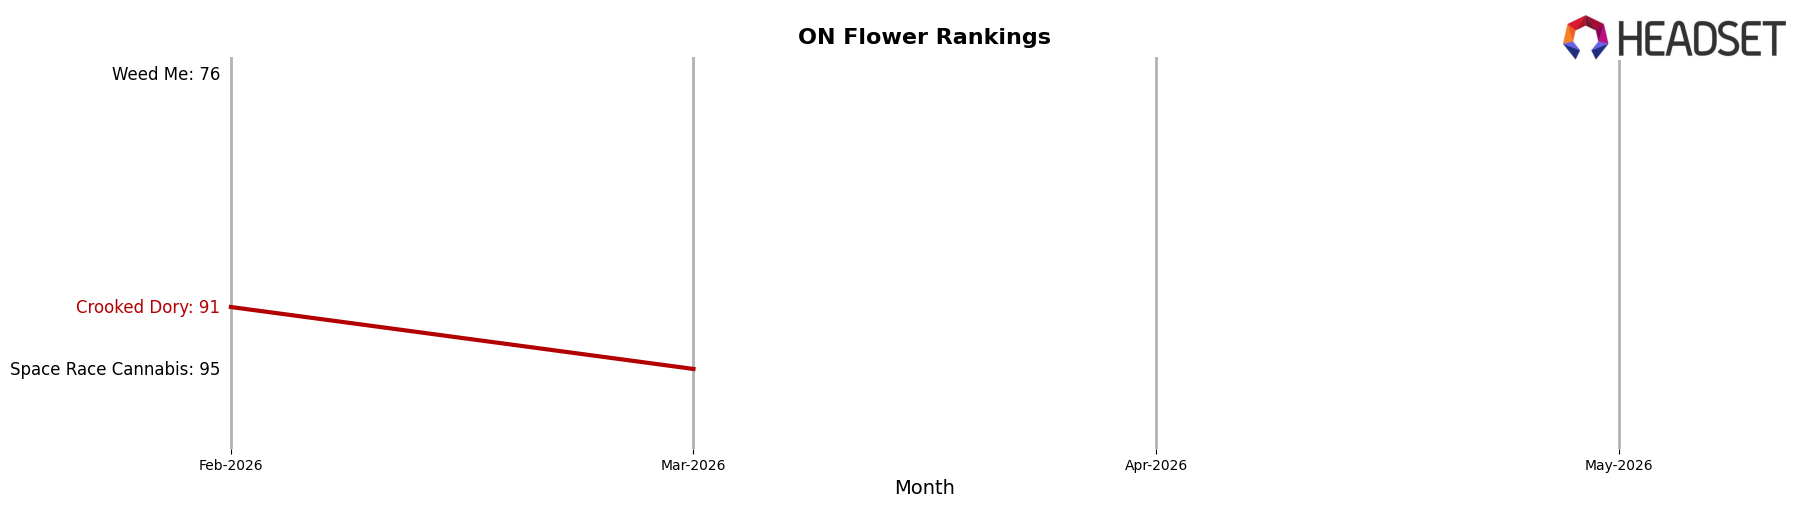
Crooked Dory is ranked #115 in ON Flower in May 2026, down 68 positions year over year from #47, and 24 spots lower than February 2026’s #91, while still far off its April 2025 peak at #35; in contrast, Shred held #1 after moving up from #2 year over year and Back Forty / Back 40 Cannabis slipped from #1 to #2 with a −8.41% YoY sales change, indicating that Crooked Dory’s rank erosion is outpacing shifts among category leaders. The combination of a 68-place YoY decline and a 24-place drop over three months, against competitors like Spinach remaining steady at #3 with +12.75% YoY sales, implies that Crooked Dory’s assortment or distribution is not keeping pace with demand consolidation at the top, and the trajectory points to further shelf risk unless mix or regional coverage is reset.
Notable Products
Gorilla Lemon Fire (28g) delivered the headline move in May 2026 with a +110.5% month-over-month surge that vaulted it to rank 4, while AAA+ Sativa Pre-Roll 5-Pack (2.5g) fell -16.0% yet held rank 1. AAA+ Sativa Pre-Roll 14-Pack (7g) also jumped +60.1% to rank 6, whereas Dreamcatcher (28g) declined -44.3% at rank 5, creating a split trajectory within Flower where two of the top five are 28g SKUs. This mix— Flower volatility paired with Pre-Roll depth at ranks 1, 2, and 6—implies Crooked Dory is tilting toward larger-format Flower swings for headline gains while relying on Pre-Rolls for baseline throughput.
Top Selling Cannabis Brands
Data for this report comes from real-time sales reporting by participating cannabis retailers via their point-of-sale systems, which are linked up with Headset’s business intelligence software. Headset’s data is very reliable, as it comes digitally direct from our partner retailers. However, the potential does exist for misreporting in the instance of duplicates, incorrectly classified products, inaccurate entry of products into point-of-sale systems, or even simple human error at the point of purchase. Thus, there is a slight margin of error to consider. Brands listed on this page are ranked in the top twenty within the market and product category by total retail sales volume.

