.svg)

Sep-2026
Sales
Trend
6-Month
Product Count
SKUs
Avg Price
YoY Sales Change
YoY Price Change


Where to Buy
Crops is stocked at 105 licensed dispensaries across New Jersey, Illinois, and Utah, 54 of them in New Jersey, with the deepest coverage in Newark, Union, Atlantic City, Bloomfield, and Fort Lee. Search by ZIP code or city below to find the closest one, or filter by product type if you are after a specific format.
Market Insights Snapshot
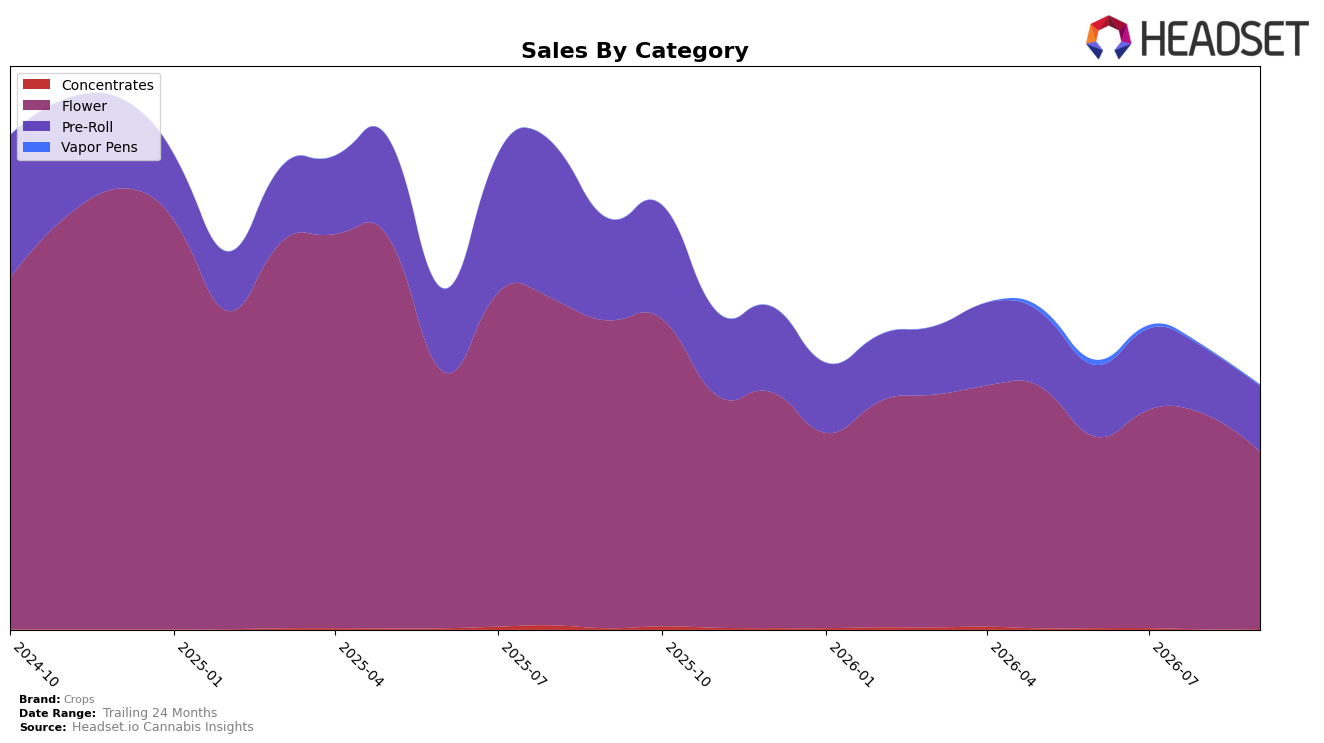
In September 2026, Crops concentrated 72.54% of sales in Flower while Pre-Roll held 26.85% and Vapor Pens and Concentrates together accounted for just 0.62%, indicating a narrowed mix tilted toward two core formats. Flower declined 42.48% year over year and 17.62% month over month, while Pre-Roll fell 35.50% year over year but only 0.63% month over month; this divergence, alongside a 304.74% month-over-month rebound in Concentrates off a small base and an 18.97% month-over-month drop in Vapor Pens, signals that monthly stability sits in Pre-Roll rather than Flower. With a brand-level year-over-year sales change of -40.56% against an average price decline of 23.91%, the volume lift from pricing did not offset unit attrition; together with a Flower category rank of 13 in New Jersey and Flower’s 72.54% share, the pattern implies channel and assortment risk concentrated in a weakening flagship category.
The mix shift implies Crops is over-indexed to a category where rank 13 in Flower limits visibility while Pre-Roll’s milder 0.63% month-over-month dip and 26.85% share provide a comparatively steadier anchor. Given Flower’s 17.62% month-over-month contraction versus a 304.74% spike in Concentrates and an 18.97% month-over-month fall in Vapor Pens, incremental growth likely comes from reallocating shelf and promo weight from Flower toward Pre-Roll and selectively testing Concentrates, while treating Vapor Pens as deprioritized. The combination of a -42.48% year-over-year decline in Flower and a -35.50% year-over-year decline in Pre-Roll, alongside a brand-level -40.56% year-over-year trend and a -23.91% average price change, implies that price reductions without category diversification are insufficient; Crops’s positioning would benefit from reducing reliance on Flower in New Jersey to stabilize rank and mix resilience.
Competitive Landscape
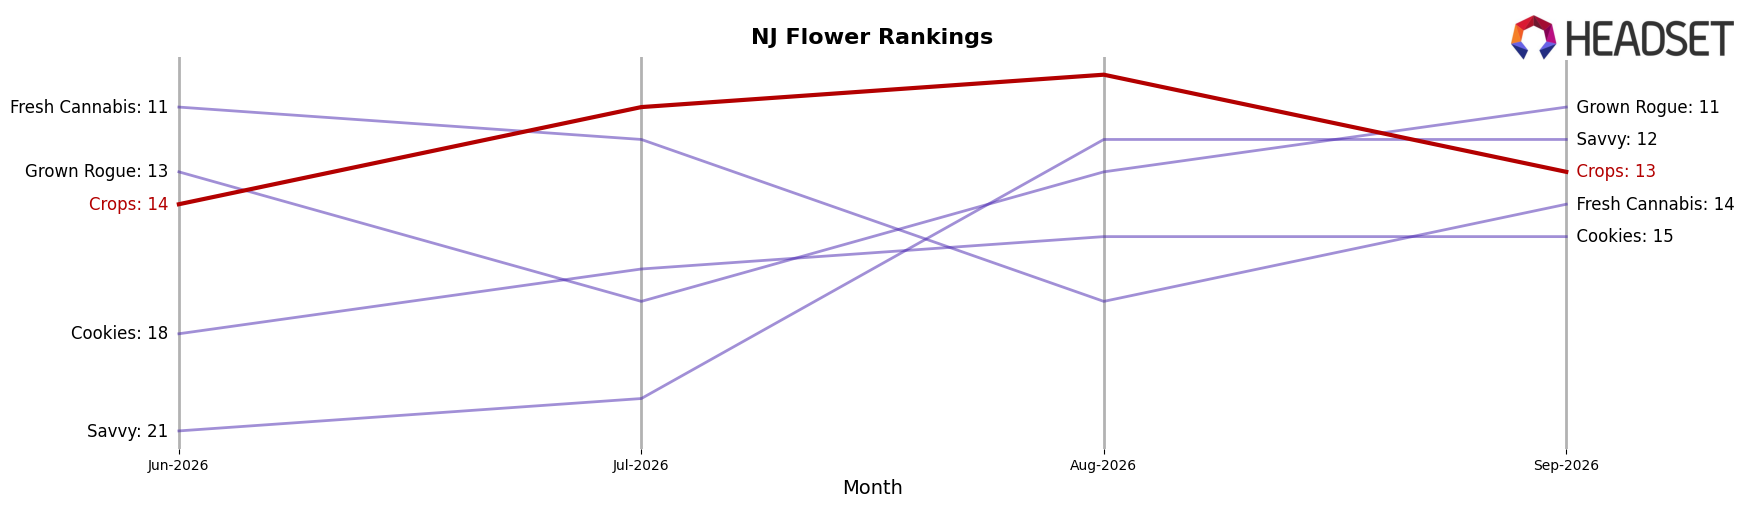
Crops sits at rank #13 in NJ Flower for September 2026, down 5 positions year over year from #8, and up 1 place versus June 2026 when it was #14; its historical ceiling was rank #4 in April 2025, a 9-position gap from today that frames the current trajectory. In contrast, Find. climbed from #6 to #1 with 111.6% year-over-year sales growth, while RYTHM slipped from #3 to #4 alongside a -9.8% sales decline, indicating competitive movement both upward and downward at the top of the table. The mix of Crops’ 1-rank quarter-over-quarter improvement and 5-rank year-over-year slide implies stabilization at a lower tier rather than a return to its April 2025 peak without a change in share capture dynamics.
Notable Products
Lime OG Pre-Roll (1g) posted the steepest decline at -24.2% MoM while dropping to rank 3, and High Society Pre-Roll (1g) fell -27.0% at rank 5, whereas Boston Tea Party (28g) rose +34.1% to rank 2; with four of the top ten as Pre-Roll SKUs concentrated in ranks 1, 3, 4, and 5, the category’s rank presence outpaces its MoM momentum. Road Trip Pre-Roll 7-Pack (3.5g) held rank 1 with no MoM signal provided, while Fried Ice Cream (3.5g) slid -15.2% at rank 9, indicating mixed velocity between Pre-Roll and Flower at the top of the chart. Boston Tea Party (28g) also led absolute dollar movement at $86,049 alongside a +34.1% MoM gain, suggesting high-bag-size Flower is capturing share even as several Pre-Roll singles retrench. The pattern implies Crops is tilting toward larger-pack Flower to stabilize revenue while assortment pruning may be needed in single-stick Pre-Rolls to prevent rank erosion.
Top Selling Cannabis Brands






Data for this report comes from real-time sales reporting by participating cannabis retailers via their point-of-sale systems, which are linked up with Headset’s business intelligence software. Headset’s data is very reliable, as it comes digitally direct from our partner retailers. However, the potential does exist for misreporting in the instance of duplicates, incorrectly classified products, inaccurate entry of products into point-of-sale systems, or even simple human error at the point of purchase. Thus, there is a slight margin of error to consider. Brands listed on this page are ranked in the top twenty within the market and product category by total retail sales volume.

