.svg)
Sep-2026
Sales
Trend
6-Month
Product Count
SKUs
Avg Price
YoY Sales Change
YoY Price Change


Where to Buy
Dab Fx is stocked at 93 licensed dispensaries across Massachusetts, with the deepest coverage in Worcester, Boston, Pittsfield, Holyoke, and Lynn. Search by ZIP code or city below to find the closest one, or filter by product type if you are after a specific format.
Market Insights Snapshot
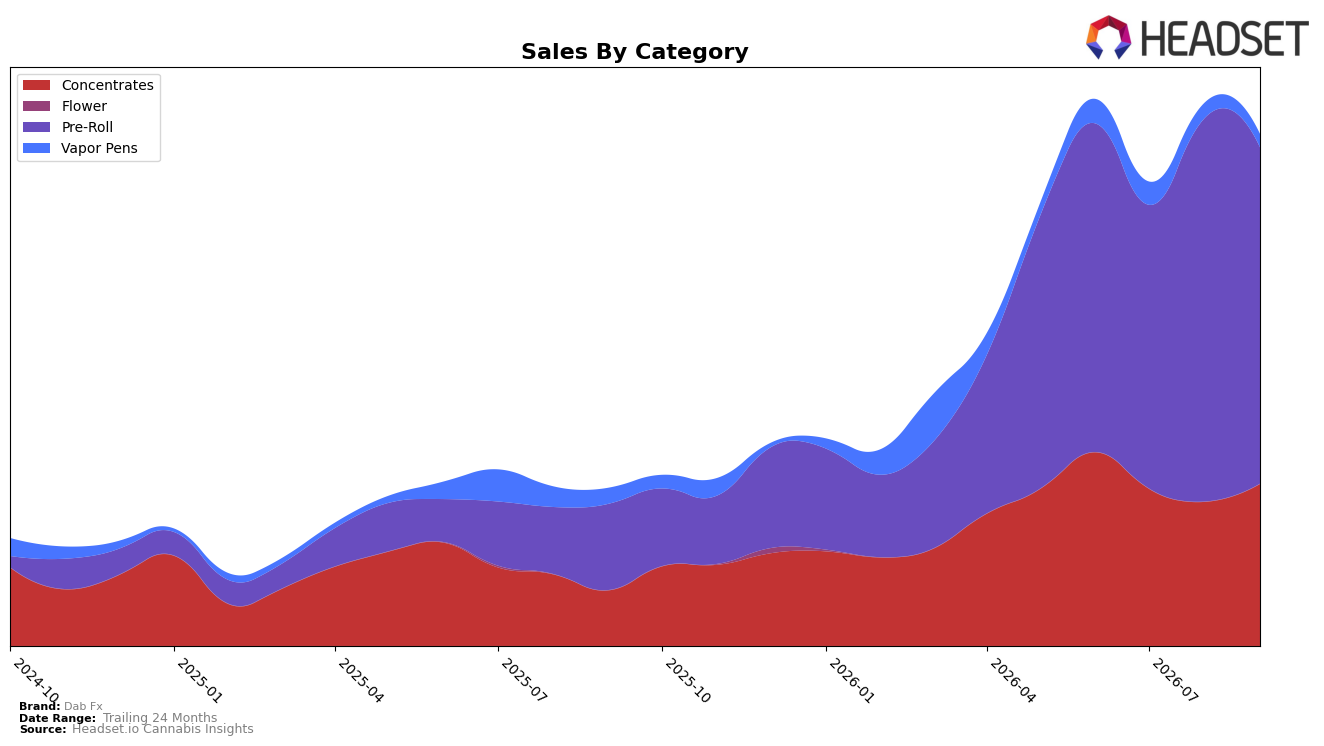
Dab Fx’s category mix in September 2026 tilted heavily to Pre-Roll at 65.80% share with 291.66% year-over-year growth but a 12.28% month-over-month decline, while Concentrates held 31.64% share with 192.89% year-over-year growth and a 12.43% month-over-month gain. Vapor Pens accounted for 2.56% share with a 16.97% year-over-year contraction and a 13.58% month-over-month drop, and the brand’s average price fell 27.61% year over year to $12.38 as Pre-Roll pricing sat lower at $10.13 versus Concentrates at $22.05. With a Pre-Roll rank of 35 in Massachusetts and a brand-level sales increase of 225.87% year over year, the data implies Dab Fx is scaling volume by leaning into lower-priced Pre-Roll while backfilling growth with higher-priced Concentrates to buffer margin pressure.
The pivot shows Dab Fx deepening penetration through a volume-led Pre-Roll core (rank 35) while reallocating momentum into Concentrates, where the 12.43% month-over-month rise alongside a 31.64% mix share can offset the 12.28% month-over-month pullback in Pre-Roll. The concurrent 27.61% year-over-year drop in average price and Vapor Pens’ 2.56% share with double-digit month-over-month and year-over-year declines indicate an intentional deprioritization of Vapor Pens in favor of a two-tier strategy: traffic capture via value-priced Pre-Roll and ticket lift via Concentrates, a configuration that positions Dab Fx to sustain growth as seasonal or promotional headwinds rotate through September 2026.
Competitive Landscape
Dab Fx sits at rank #35 in MA Pre-Roll for September 2026, up 74 positions year over year from #109, and 6 spots better than June 2026’s #41, while its peak of #32 in August 2026 indicates a recent high-water mark; meanwhile, Jeeter held #1 with a 25.6% YoY sales increase and Cali-Blaze stayed at #2 with 110.7% YoY sales growth, suggesting Dab Fx’s rank gains are occurring amid faster top-tier momentum, and the climb from #41 to #35 quarter-over-quarter alongside a one-year jump of 74 ranks implies Dab Fx is transitioning from peripheral presence toward mid-pack relevance that will require continued share capture to sustain.

Notable Products
Tarantula - Mango Rush Infused Pre-Roll (1g) posted the biggest swing in September 2026 with a 221.99% MoM surge to rank 3, outpacing the 107.08% jump for Tarantula - Pineapple Kush Infused Pre-Roll (1g) at rank 1 and contrasting the -11.26% dip for Tarantula - Tropical Dream Infused Pre-Roll (1g) at rank 5. Nine of the top ten are Pre-Roll SKUs, indicating category concentration as share consolidates at the very top ranks while mid-tier Pre-Rolls shed momentum. This pattern implies Dab Fx is concentrating velocity into a few spike-prone Tarantula variants while pruning or de-emphasizing slower Pre-Rolls.
Top Selling Cannabis Brands






Data for this report comes from real-time sales reporting by participating cannabis retailers via their point-of-sale systems, which are linked up with Headset’s business intelligence software. Headset’s data is very reliable, as it comes digitally direct from our partner retailers. However, the potential does exist for misreporting in the instance of duplicates, incorrectly classified products, inaccurate entry of products into point-of-sale systems, or even simple human error at the point of purchase. Thus, there is a slight margin of error to consider. Brands listed on this page are ranked in the top twenty within the market and product category by total retail sales volume.

