May-2026
Sales
Trend
6-Month
Product Count
SKUs
Avg Price
YoY Sales Change
YoY Price Change
Market Insights Snapshot
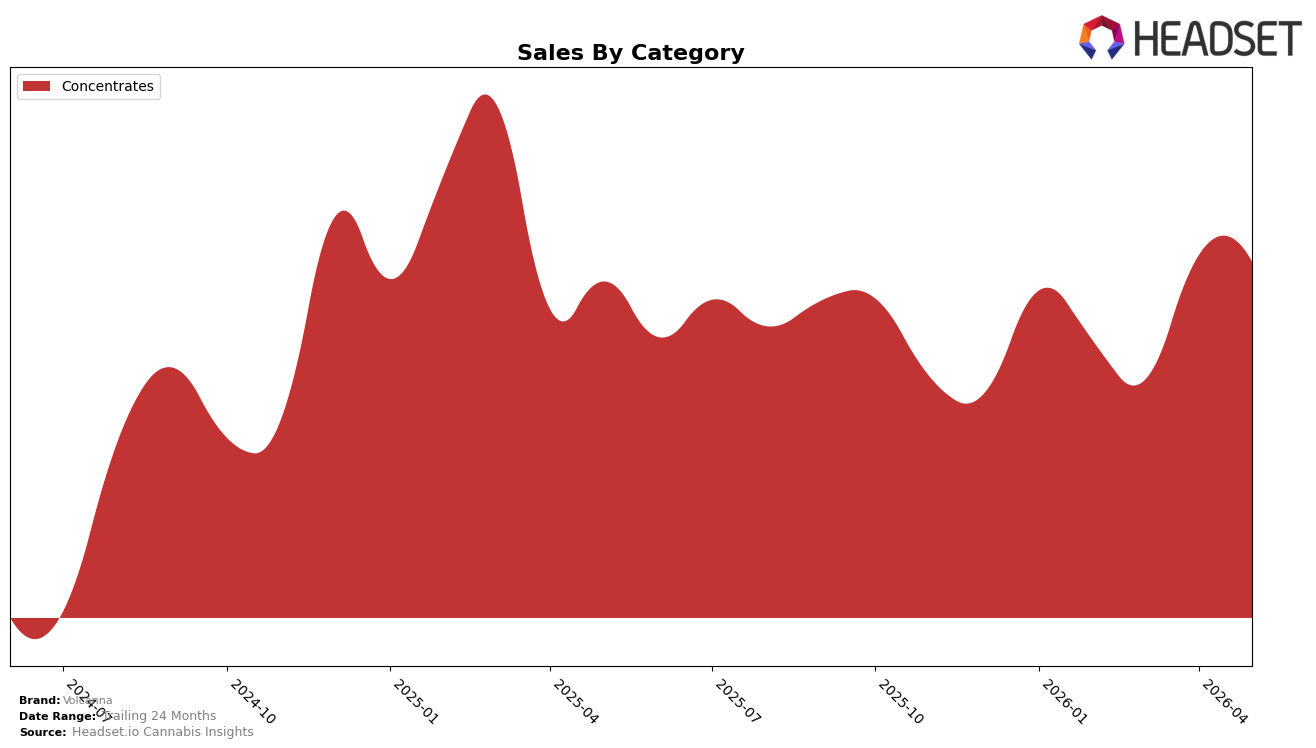
Volcanna operated as a single-category brand in May 2026, with Concentrates comprising 100.0% of sales and a category rank position of 15 in Massachusetts. Within that mix, year-over-year sales in Concentrates rose 5.8% while month-over-month dipped 1.7%, and the average price fell 22.1% YoY alongside a current average ticket of $31.62. The pattern implies a volume-led Concentrates strategy sustaining share despite a short-term monthly retrenchment and a mid-tier rank position.
These shifts point to a positioning anchored in affordability within Concentrates: a 22.1% YoY price reduction paired with a 5.8% YoY sales increase suggests elasticity capture at the expense of month-over-month momentum at -1.7%. With 100.0% category concentration and a rank of 15 in Massachusetts, the brand is trading depth for breadth, implying that near-term gains hinge on price-sensitive conversion while longer-term growth will require either mix diversification or rank advancement within Concentrates.
Competitive Landscape
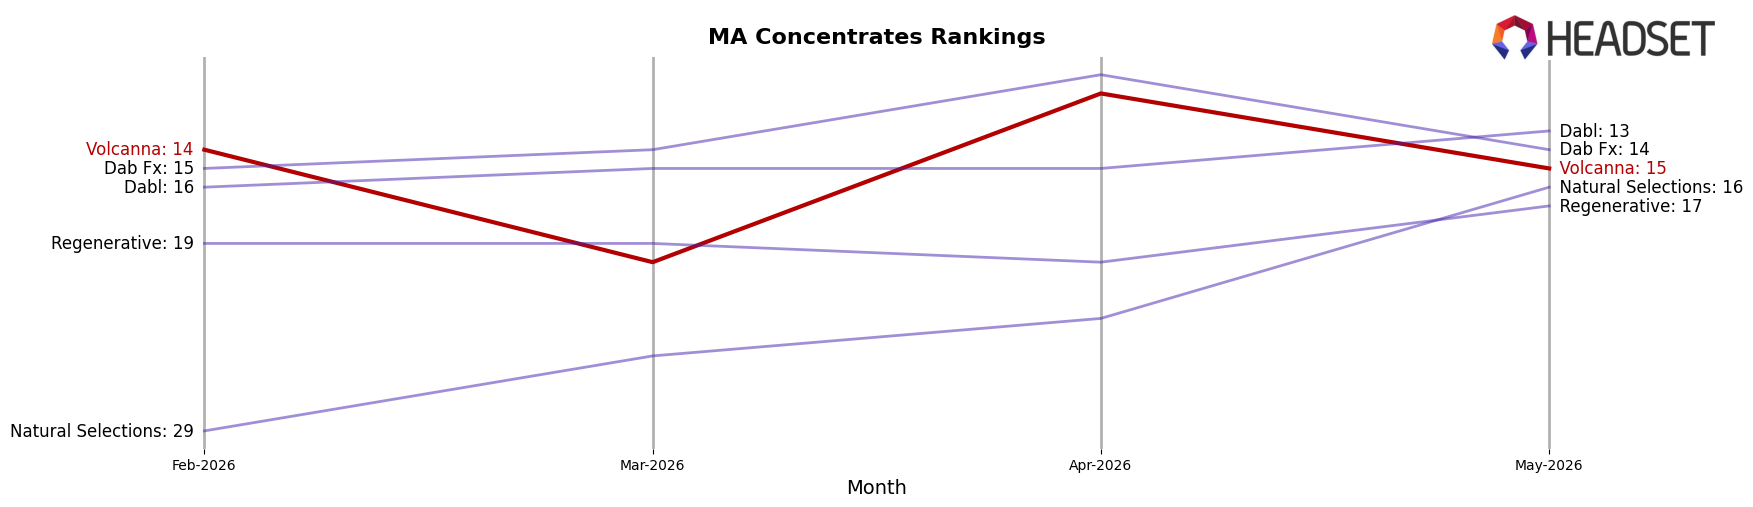
Volcanna ranks #15 in MA Concentrates in May 2026, improving 1 place from #16 year over year but slipping 1 place from #14 in February 2026, while still 5 spots below its peak of #10 from January 2026; in contrast, Good Chemistry Nurseries held at #1 year over year with a 35.0% YoY sales gain and Harbor House Collective surged from #17 to #5 alongside a 189.2% YoY increase, indicating that modest rank stabilization for Volcanna amid faster-moving leaders implies a need to outpace mid-tier churn or risk drifting further from the top 10.
Notable Products
Animal Tsunami Crumble (1g) posted the steepest movement in May 2026 with a -45.1% month-over-month drop while sitting at rank 5, and Burnt Orange Crumble (1g) also contracted -14.3% despite holding rank 1. Mango Chem Crumble (1g) was the lone mover upward at +8.7% at rank 3, indicating mixed momentum within the top tier. With all top-10 placements concentrated in Concentrates and only one SKU growing, the mix points to overreliance on a single category where leadership is thinning at the top and volatility is rising.
Top Selling Cannabis Brands
Data for this report comes from real-time sales reporting by participating cannabis retailers via their point-of-sale systems, which are linked up with Headset’s business intelligence software. Headset’s data is very reliable, as it comes digitally direct from our partner retailers. However, the potential does exist for misreporting in the instance of duplicates, incorrectly classified products, inaccurate entry of products into point-of-sale systems, or even simple human error at the point of purchase. Thus, there is a slight margin of error to consider. Brands listed on this page are ranked in the top twenty within the market and product category by total retail sales volume.

