Jun-2026
Sales
Trend
6-Month
Product Count
SKUs
Avg Price
YoY Sales Change
YoY Price Change
Market Insights Snapshot
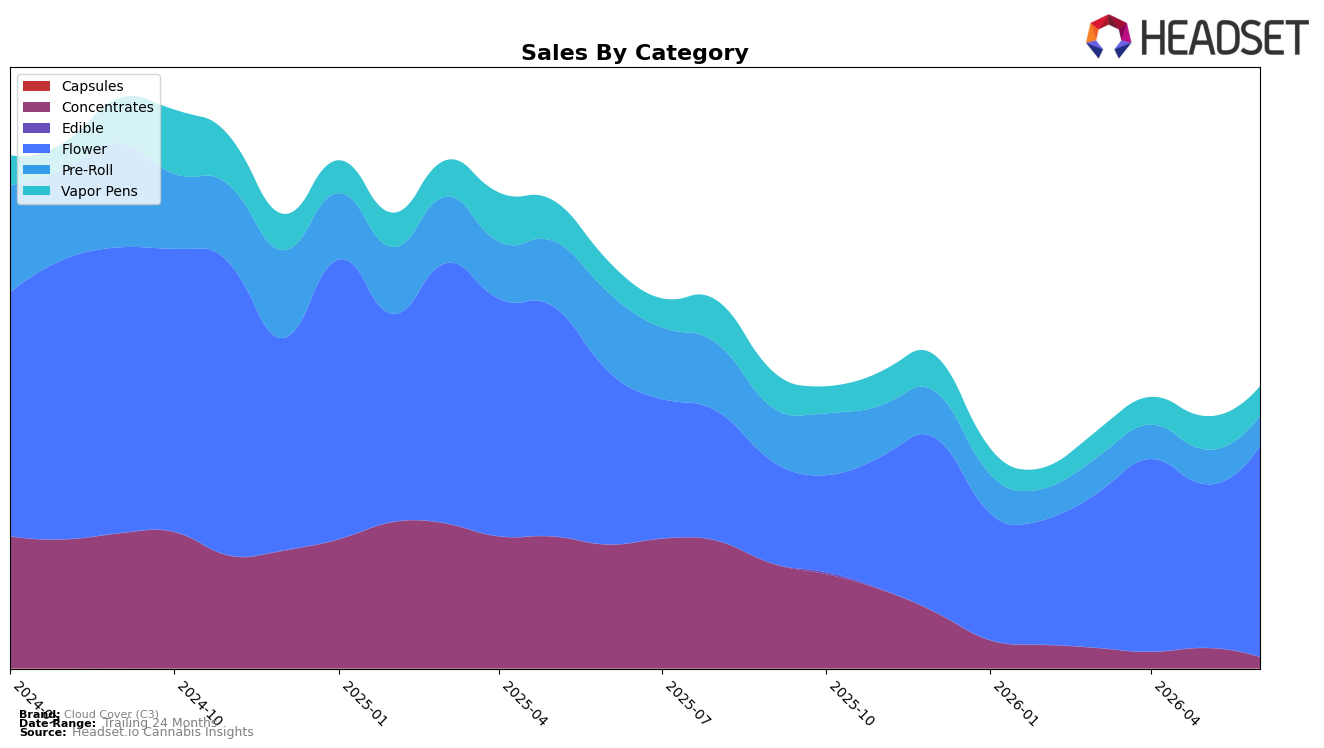
Cloud Cover (C3) concentrated heavily in Flower at 74.91% share, where sales rose 21.70% year over year and 28.76% month over month, while Vapor Pens at 10.32% share fell 6.29% YoY and 12.33% MoM. Pre-Roll contributed 10.84% share with a 61.33% YoY decline and an 11.68% MoM drop, and Concentrates shrank to 3.93% share with a 91.06% YoY and 44.97% MoM contraction; despite category-mix headwinds, average price rose 9.45% YoY to $21.10. In Missouri Flower, the brand held rank 27, and the mix shift toward Flower implies reliance on a single growth engine to offset double-digit declines in three smaller segments.
The tilt toward higher-ticket inhalables is uneven: Flower pricing at $23.02 supports mix, but Vapor Pens at $48.21 and Concentrates at $21.23 contracted, leaving the overall MoM momentum to hinge on Flower’s 28.76% surge against 12.33% and 44.97% pullbacks elsewhere. With brand sales down 30.82% YoY and 48.99% over 24 months alongside a 9.45% YoY price increase, the pattern implies Cloud Cover (C3) is trading into a narrower, price-accepting Flower base while ceding breadth in Pre-Roll and Concentrates, which positions the brand as a Flower-first player whose share and rank (27 in Missouri Flower) will depend on maintaining category depth rather than multi-category reach.
Competitive Landscape
Cloud Cover (C3) ranks #27 in MO Flower in June 2026, improving 8 positions from #35 year over year and 7 positions from #34 in March 2026, while still sitting 4 places below its April 2026 peak at #23; by contrast, Sinse Cannabis moved up from #5 to #2 and Amaze Cannabis advanced from #6 to #4 alongside a 43.8% year-over-year sales gain, indicating that Cloud Cover (C3)’s climb is slower than leaders gaining share despite Flora Farms holding at #1 with a 5.1% year-over-year sales decline; the trajectory implies Cloud Cover (C3) is recovering rank but not yet converting momentum at the pace needed to close the gap with top-5 movers.

Notable Products
LA Purp (3.5g) delivered the standout movement with a +90% month-over-month surge to rank 1, while Ice Cream Cake (3.5g) fell -50% to rank 8, together signaling a sharp reordering at the top. With Flower occupying all top-10 ranks and three 3.5g SKUs concentrated in the top five (ranks 1–3), the mix is tilting toward branded eighths over bulk despite Fruit Loops (Bulk) holding rank 7. Apple Tartz (3.5g) declined -45% at rank 6 as LA Purp (3.5g) vaulted to 1, suggesting consumer substitution within the 3.5g lineup toward a narrower set of winners. The pattern implies Cloud Cover (C3) is consolidating demand into a few headline Flower SKUs, pointing to a product strategy that favors depth behind breakout eighths over broad variety.
Top Selling Cannabis Brands
Data for this report comes from real-time sales reporting by participating cannabis retailers via their point-of-sale systems, which are linked up with Headset’s business intelligence software. Headset’s data is very reliable, as it comes digitally direct from our partner retailers. However, the potential does exist for misreporting in the instance of duplicates, incorrectly classified products, inaccurate entry of products into point-of-sale systems, or even simple human error at the point of purchase. Thus, there is a slight margin of error to consider. Brands listed on this page are ranked in the top twenty within the market and product category by total retail sales volume.

