Jun-2026
Sales
Trend
6-Month
Product Count
SKUs
Avg Price
YoY Sales Change
YoY Price Change
Market Insights Snapshot
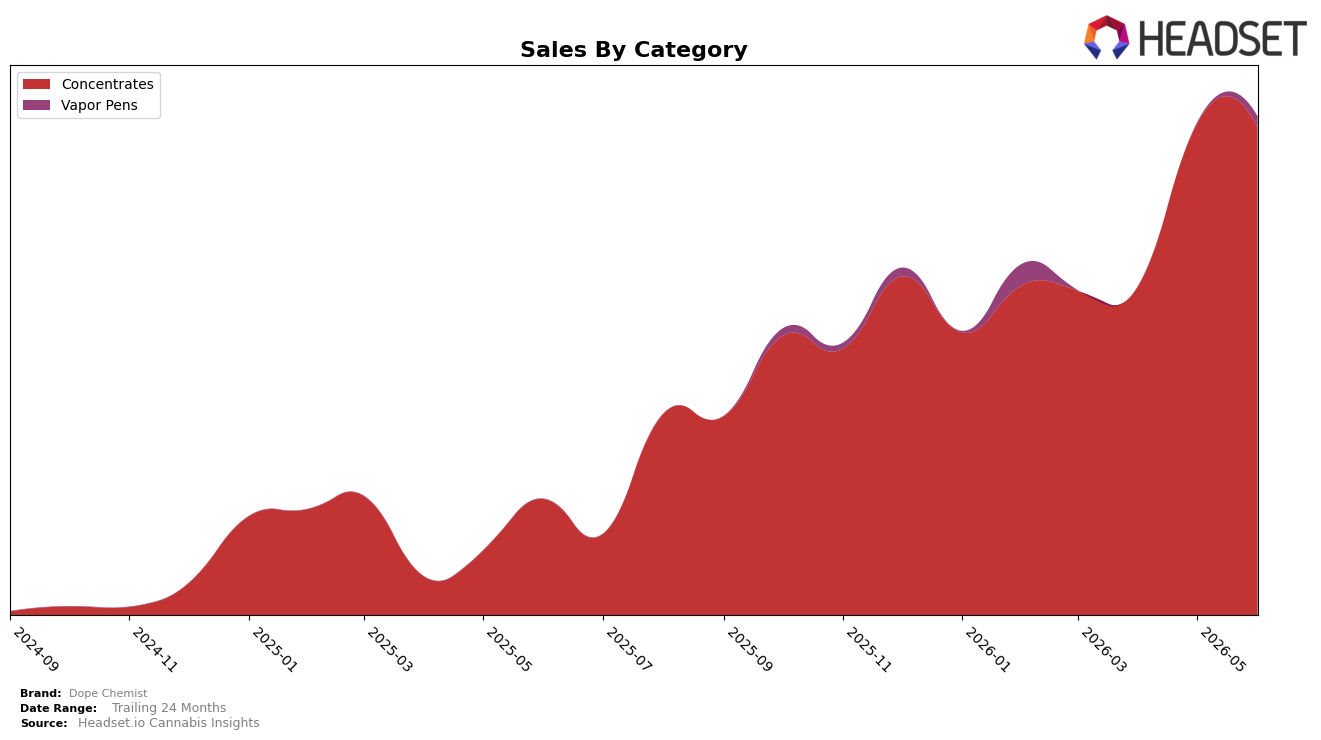
Dope Chemist’s June 2026 mix is concentrated in Concentrates at 97.78% share with a -0.88% month-over-month dip and a 320.34% year-over-year gain, while Vapor Pens holds 2.22% share with a 1,663.46% month-over-month surge and no year-over-year baseline. This split coincides with a 329.91% brand-level year-over-year sales increase and a -13.14% year-over-year average price change, implying the category expansion is volume-led rather than price-led. With Concentrates ranked 14 in Massachusetts and the top state flagged as MA, the brand is anchored in a single-category footprint even as Vapor Pens accelerates, suggesting early diversification without material share rebalancing yet.
The steep 1,663.46% month-over-month rise in Vapor Pens alongside a -0.88% month-over-month move in Concentrates implies incremental, not cannibalistic, growth, and positions Dope Chemist to add a second demand vector while preserving a 97.78% core. Coupled with a -13.14% year-over-year price decline against a 320.34% Concentrates year-over-year lift, the brand is effectively trading price for scale, which can support share capture toward or above rank 14 if sustained. The pattern indicates near-term positioning as a Concentrates-first label that is using lower price points and a nascent Vapor Pens presence (2.22% share) to open new doors without eroding the core, setting up optionality to convert June 2026 trial in Vapor Pens into repeat while defending the core category rank.
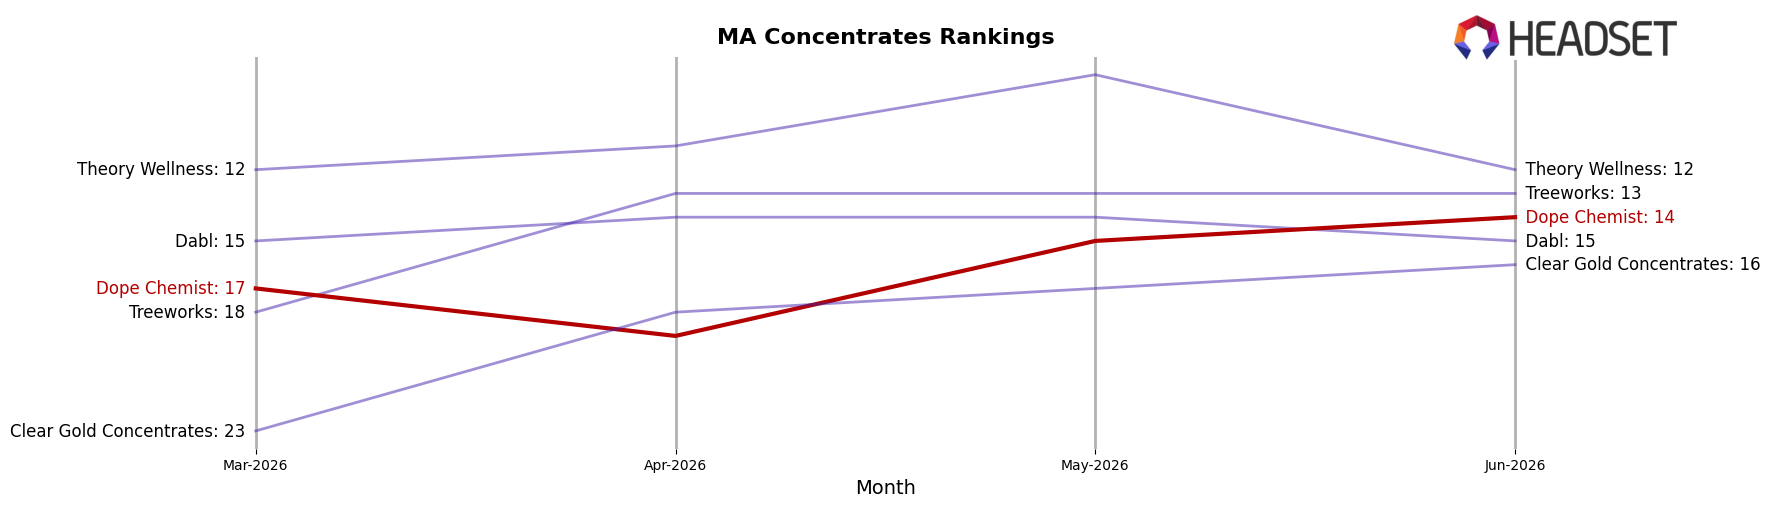
Competitive Landscape
Dope Chemist sits at rank #14 in MA Concentrates in June 2026, a 27-place climb from #41 year over year, and a 3-position rise from #17 in March 2026 to its peak at #14 in June 2026; by contrast, Good Chemistry Nurseries held #1 both year over year and currently while growing sales 31%, and Crispy Commission Concentrates remained near the top at #2 despite a 24% sales decline, indicating Dope Chemist’s share gains are driven more by rank momentum than category-wide lift. The combination of a 27-rank YoY improvement and a 3-rank quarter-over-quarter step-up implies a trajectory toward sustained mid-tier presence rather than immediate top-5 contention.
Notable Products
Moroccan Peaches Live Hash Rosin (1g) posted the steepest movement in June 2026 with a -63% month-over-month drop and slid to rank 7, while Spec Ops Live Hash Rosin (1g) also declined -40% to a tie at rank 7, indicating a rapid cool-off in certain Live Hash Rosin SKUs. At the top, Sour Nutz Cured Badder (1g) held rank 1 and Funky Junk Live Hash Rosin (1g) sat at rank 2, signaling a split where premium rosin weakens at mid-table as cured and select live formats anchor the peaks. With four of the top ten in Live Hash Rosin and three in Live Badder, concentration in solventless and live textures is high even as volatility intensifies. The pattern implies Dope Chemist is leaning into a solventless-forward lineup but must rebalance around fewer mid-tier rosins to stabilize share as winners cluster at ranks 1–3 and underperformers compress around rank 7.
Top Selling Cannabis Brands
Data for this report comes from real-time sales reporting by participating cannabis retailers via their point-of-sale systems, which are linked up with Headset’s business intelligence software. Headset’s data is very reliable, as it comes digitally direct from our partner retailers. However, the potential does exist for misreporting in the instance of duplicates, incorrectly classified products, inaccurate entry of products into point-of-sale systems, or even simple human error at the point of purchase. Thus, there is a slight margin of error to consider. Brands listed on this page are ranked in the top twenty within the market and product category by total retail sales volume.

