Jun-2026
Sales
Trend
6-Month
Product Count
SKUs
Avg Price
YoY Sales Change
YoY Price Change
Market Insights Snapshot
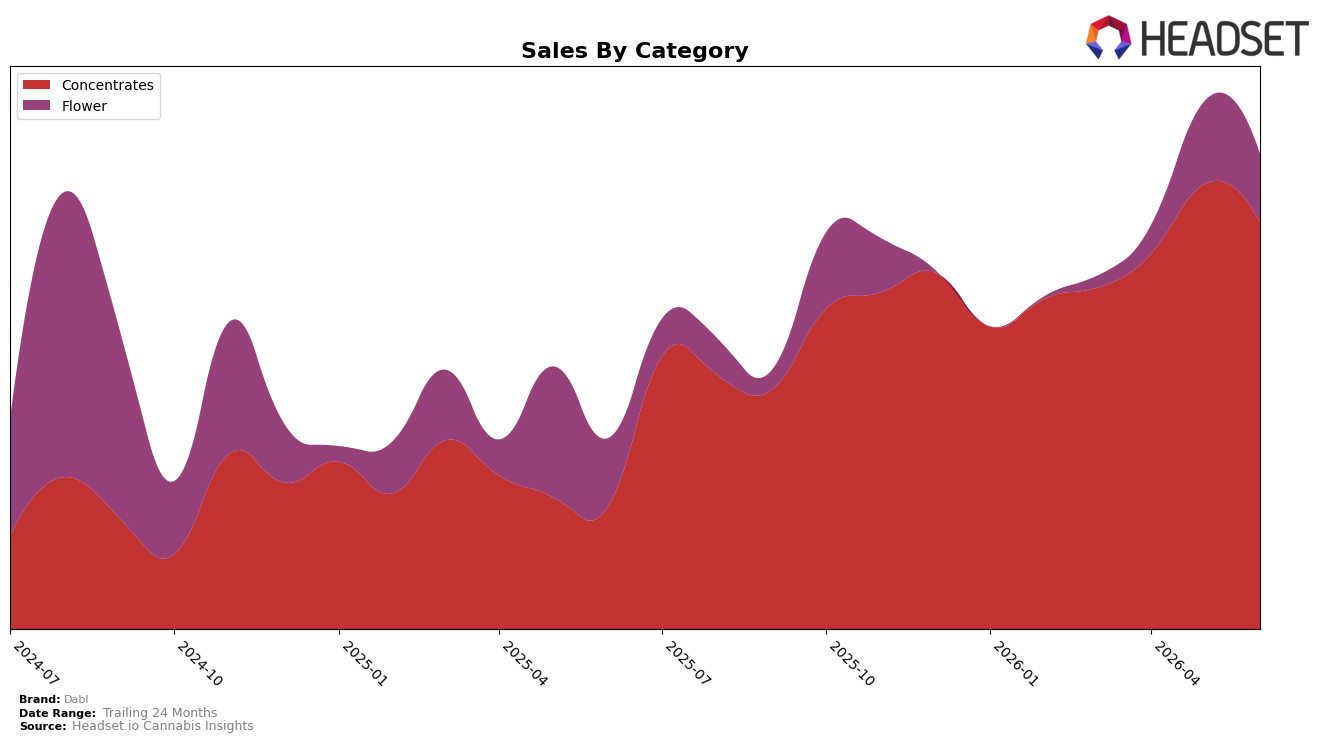
In June 2026, Dabl’s mix was heavily concentrated in Concentrates at 84.48% share, up 218.76% year over year but down 8.59% month over month, while Flower held 15.52% share with just 1.46% year-over-year growth and a 15.59% month-over-month decline. Against brand-level sales growth of 139.22% year over year and a 30.97% year-over-year drop in average price to $35.60, the 31.70 average price in Concentrates versus 107.55 in Flower indicates volume is accruing to the lower-priced category as its rank in Massachusetts Concentrates sits at 15, implying Dabl is scaling primarily through Concentrates even as near-term month-over-month softness tempers momentum.
The mix tilt and pricing spread imply Dabl is positioning as a value-forward Concentrates player in Massachusetts, where a 15th-place rank in Concentrates and an 8.59% month-over-month dip suggest sensitivity to intra-category price moves while maintaining share via volume. With Flower down 15.59% month over month and only 1.46% year-over-year growth against a premium 107.55 average price, the current configuration implies Dabl’s competitive leverage sits in driving Concentrates penetration and basket entry rather than trading consumers up in Flower, setting expectations for share defense tied more to price elasticity and promotional cadence than to premiumization.
Competitive Landscape
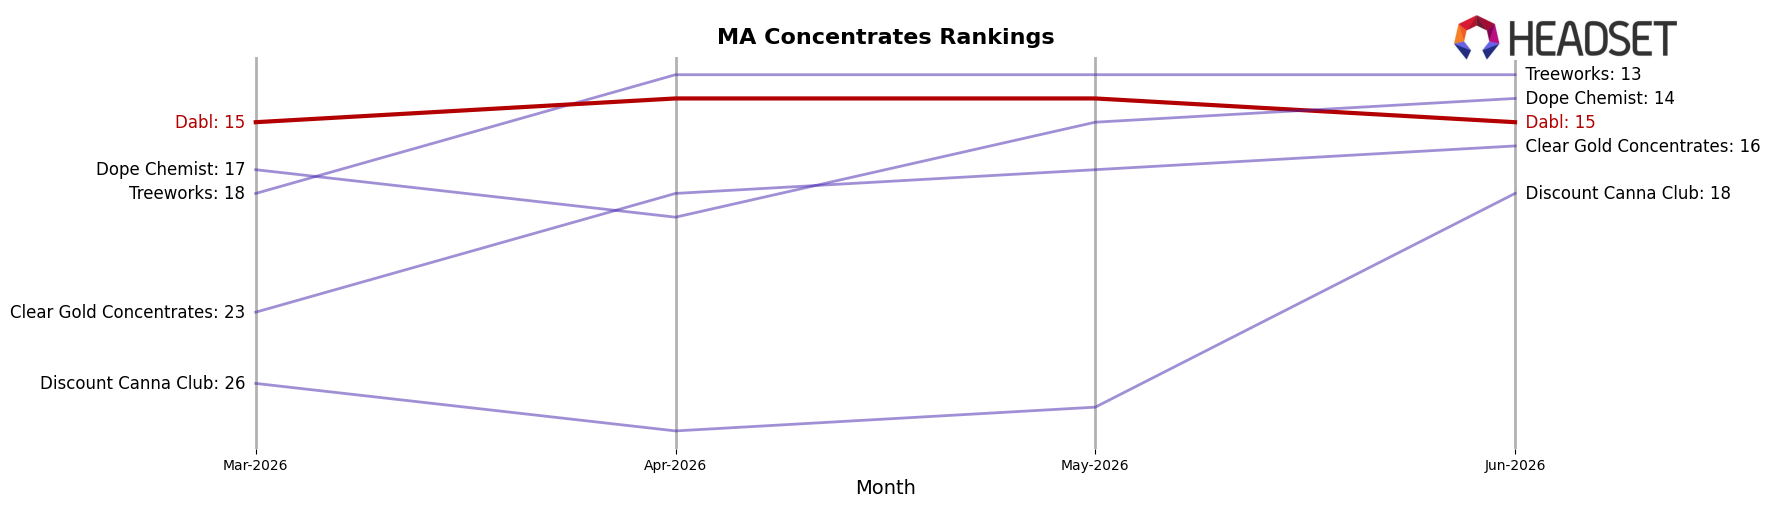
Dabl ranks #15 in MA Concentrates in June 2026, improving 11 positions from #26 year over year, while holding flat versus March 2026 at #15 and still trailing its December 2025 peak of #12; in contrast, Good Chemistry Nurseries held #1 year over year with sales up 31.3%, and Crispy Commission Concentrates stayed at #2 despite a 23.7% sales decline, indicating that Dabl’s upward rank shift is tied more to steady placement and competitor volatility than to a breakout toward the top tier, implying a path of gradual share capture unless a step-change lifts it beyond the #12 ceiling.
Notable Products
Devil's Dust THCA Isolate (2g) posted the standout move in June 2026 with a 74.1% month-over-month gain that vaulted it to rank 1, while Lemon Fatman Live Dablicator (1g) fell 28.9% to rank 4. Concentrates occupy nine of the top ten ranks, and the category split is reinforced by Blue Dream Live Resin Dablicator (1g) rising 12.3% at rank 3 alongside Lemon Fatman Live Resin Badder (0.5g) up 18.9% at rank 2. The pattern implies Dabl is consolidating around concentrates-led formats where rapid share swings can be engineered product-by-product, nudging the mix away from reliance on single large Flower entries despite Booberry Cookies (28g) up 38.9% at rank 6 and generating $18,661.
Top Selling Cannabis Brands
Data for this report comes from real-time sales reporting by participating cannabis retailers via their point-of-sale systems, which are linked up with Headset’s business intelligence software. Headset’s data is very reliable, as it comes digitally direct from our partner retailers. However, the potential does exist for misreporting in the instance of duplicates, incorrectly classified products, inaccurate entry of products into point-of-sale systems, or even simple human error at the point of purchase. Thus, there is a slight margin of error to consider. Brands listed on this page are ranked in the top twenty within the market and product category by total retail sales volume.

