.svg)

Sep-2026
Sales
Trend
6-Month
Product Count
SKUs
Avg Price
YoY Sales Change
YoY Price Change


Market Insights Snapshot
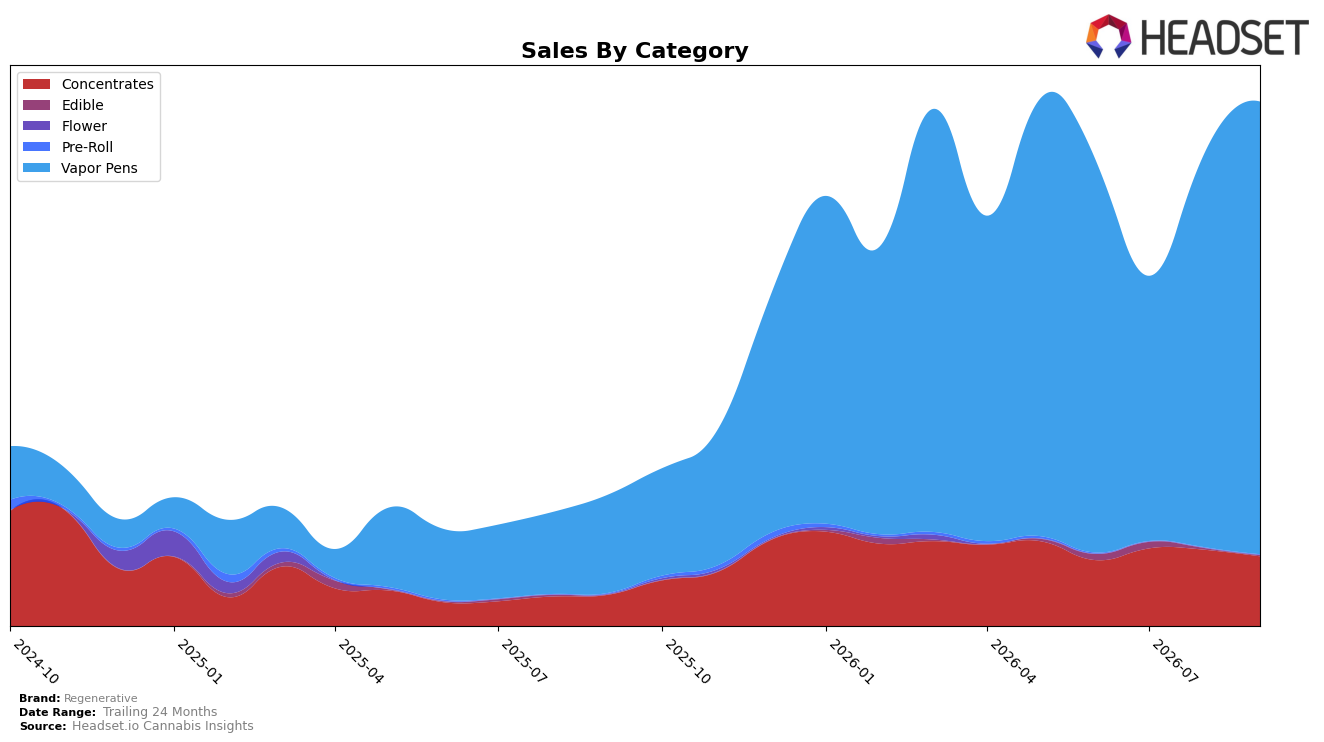
Regenerative’s mix in September 2026 is concentrated in Vapor Pens at 86.56% share with year-over-year growth of 361.97% and month-over-month growth of 14.80%, while Concentrates hold 13.30% share with 123.89% YoY and an -8.64% MoM decline; Edible sits at 0.15% share with a -38.13% MoM drop and no comparable YoY. This mix sits alongside a brand-level YoY sales increase of 303.56% and a 24-month increase of 333.57%, with average price down 5.82%, indicating the bulk of the expansion is coming from higher unit throughput in Vapor Pens rather than price, while Concentrates’ momentum is slower and Edible remains non-material. The pattern implies a single-category engine is carrying September 2026 results, with Vapor Pens widening its lead and Concentrates acting as a secondary but decelerating pillar.
Positioning-wise, a 29 rank in Vapor Pens in Massachusetts combined with an 86.56% category reliance and a 14.80% MoM uptick points to headroom coming primarily from rank gains within that lane, while the 5.82% average price decline suggests price elasticity is supporting share capture more than premiumization. With Concentrates at 13.30% share but an -8.64% MoM step back, the portfolio’s near-term leverage remains in Vapor Pens scale rather than cross-category balance, and the -38.13% MoM in Edible indicates little immediate diversification. The implication is that September 2026 mix concentrates risk and upside in Vapor Pens: advancing from rank 29 and sustaining double-digit MoM in that category is the clearest route to incremental share, while stabilization in Concentrates would mainly serve to reduce volatility rather than drive the next leg of growth.
Competitive Landscape
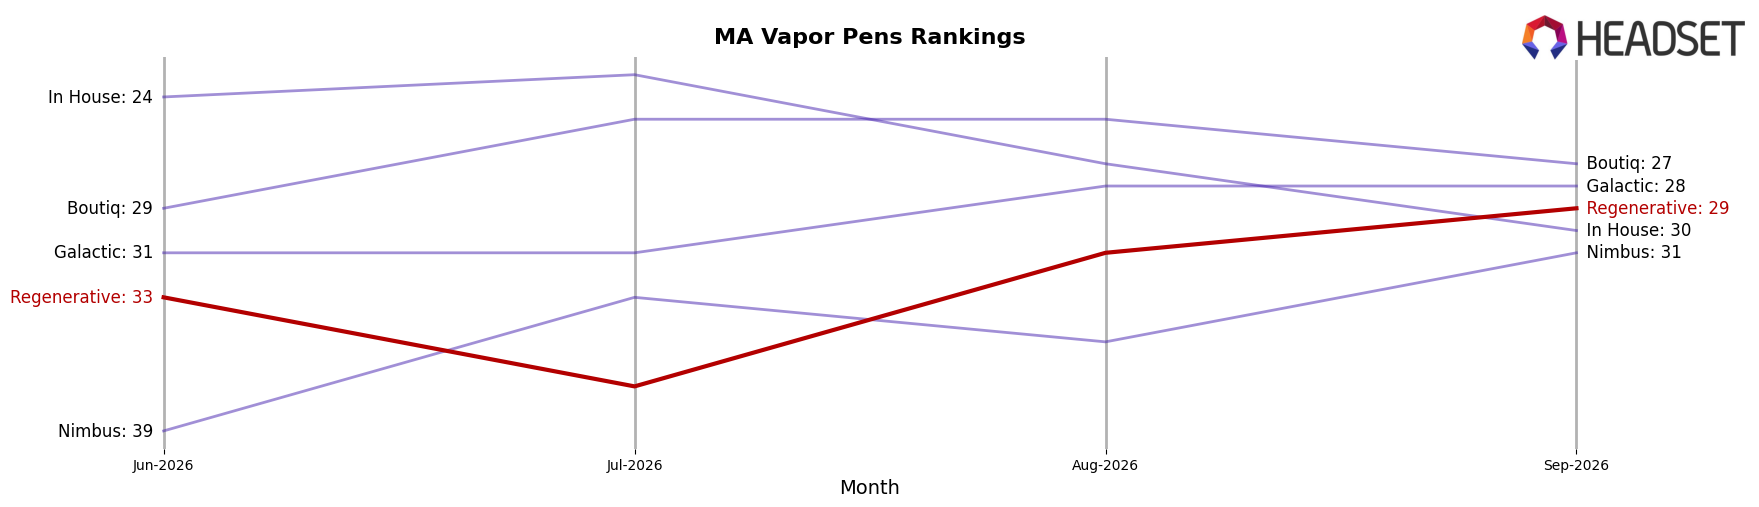
Regenerative sits at rank #29 in MA Vapor Pens for September 2026, improving 35 positions year over year from #64, and rising 4 spots since June 2026 when it was #33; however, it remains below its peak rank of #25 from March 2026. In contrast, Jeeter jumped from #23 to #4 alongside a 421.5% YoY sales increase, while Select held at #2 despite an 11.7% YoY sales decline, indicating that upward mobility at the top can come from both expansion and share defense. With Fernway steady at #1 and up 43.6% YoY in sales, and Dime Industries advancing to #5 from #6 on 63.0% YoY sales growth, Regenerative’s step-up from #64 to #29 but stalling below its March 2026 peak implies a mid-tier climb that requires further velocity gains to break sustainably into the top 25.
Notable Products
Lemon Headz OG Distillate Cartridge (1g) posted the largest movement with +111% MoM and held rank 1, while Blueberry Muffin Live Resin Cartridge (1g) climbed +109% MoM to rank 2, indicating outsized upside concentrated at the very top. In contrast, Pink Lemonade Live Resin Cartridge (1g) fell -52% MoM at rank 7 and Lemon Slushie Distillate Cartridge (1g) slid -43% MoM at rank 8, creating a bifurcation where gains above 100% coexist with declines worse than -40%. Eight of the top ten are Vapor Pens SKUs with a split between Distillate and Live Resin, and Pineapple Candy Distillate Cartridge (1g) dipped -7% MoM at rank 5 while Shirley Temple Distillate Cartridge (1g) dropped -27% MoM at rank 6 off a $24,641 base, pointing to selective consumer pull toward a few leaders rather than broad-line momentum. The pattern implies a product mix shifting toward hero Distillate SKUs that can carry share even as several mid-tier Live Resin and Distillate items retrench, suggesting a focus on scaling winners over breadth.
Top Selling Cannabis Brands






Data for this report comes from real-time sales reporting by participating cannabis retailers via their point-of-sale systems, which are linked up with Headset’s business intelligence software. Headset’s data is very reliable, as it comes digitally direct from our partner retailers. However, the potential does exist for misreporting in the instance of duplicates, incorrectly classified products, inaccurate entry of products into point-of-sale systems, or even simple human error at the point of purchase. Thus, there is a slight margin of error to consider. Brands listed on this page are ranked in the top twenty within the market and product category by total retail sales volume.

