Jun-2026
Sales
Trend
6-Month
Product Count
SKUs
Avg Price
YoY Sales Change
YoY Price Change
Market Insights Snapshot
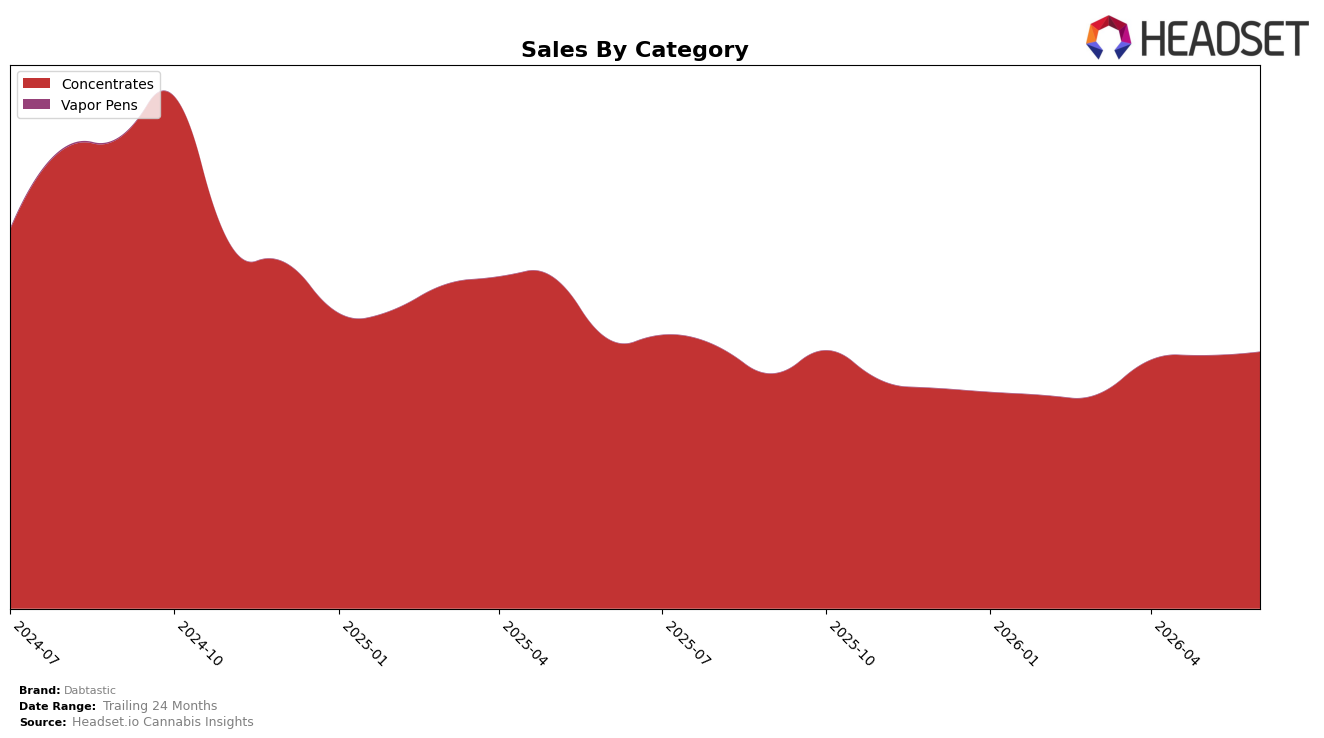
In June 2026, Dabtastic operated as a single-category brand with Concentrates at 100.0% of sales share, posting a year-over-year decline of 4.7% alongside a month-over-month uptick of 1.4%. Average price rose 4.2% year over year while overall brand sales fell 4.7%, and the brand held rank 13 within Concentrates in Washington. The mix concentration entirely in Concentrates, paired with a small MoM lift but negative YoY trend, implies the brand is leaning on incremental pricing and short-cycle velocity gains rather than breadth to offset category softness.
The combination of a 100.0% reliance on Concentrates and a rank of 13 in Washington suggests mid-pack visibility where price-led tactics (4.2% YoY price increase) risk trading volume for margin. With a 1.4% MoM sales rise against a 4.7% YoY decline, the pattern points to recent promotional or distribution tweaks lifting near-term sell-through without reversing the annual contraction, implying Dabtastic’s positioning is narrowly anchored to Concentrates dynamics and sensitive to competitive price points and assortment depth within the segment.
Competitive Landscape
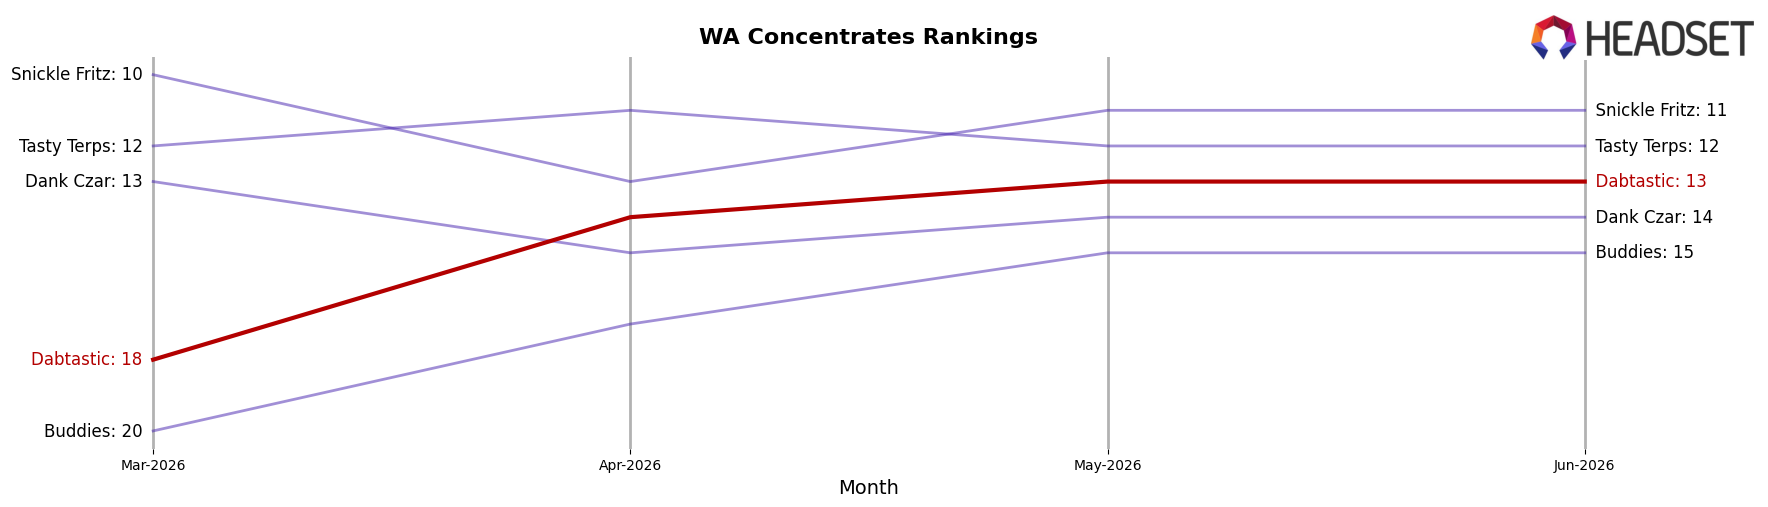
Dabtastic sits at rank #13 in Washington Concentrates for June 2026, slipping 1 place year over year from #12 but improving 5 places from #18 in March 2026, while its peak of #7 in October 2024 underscores how far it has to climb; meanwhile, Constellation Cannabis advanced from #7 to #3 with a 44% YoY sales gain and Dabstract moved from #5 to #4 with 23% YoY growth, whereas Ooowee held #1 despite a 7% YoY sales decline and Oleum Extracts (Oleum Labs) slipped from #4 to #5; the pattern implies Dabtastic’s recent quarter-on-quarter climb is recovery rather than momentum, as upward-moving rivals are consolidating higher ranks while flat-to-declining leaders still outposition it.
Notable Products
Goofiez Sugar Wax (1g) posted the standout move in June 2026 with a +31.3% month-over-month rise to rank 7, while Grapefruit Zlushiez Sugar Wax (1g) slipped -8.8% at rank 10, indicating volatility is concentrated in the long tail rather than the leaders. Sativa Wax 3-Pack (3g) held rank 1 despite a -3.5% decline, and Indica Wax 3-Pack (3g) remained at rank 2 with a flat -0.1% change, so demand is anchored in bundle formats even as single-gram SKUs swing. Four of the top ten are Sugar Wax SKUs, yet the top three ranks are dominated by Wax 3-Packs or non-sugar wax entries, implying that multi-gram value packs set the pace while flavor-driven Sugar Wax variants provide opportunistic spikes. This mix points to a commercial direction that prioritizes volume through 3-pack formats with selective bets on single-gram Sugar Wax drops to capture incremental, high-variance upside.
Top Selling Cannabis Brands
Data for this report comes from real-time sales reporting by participating cannabis retailers via their point-of-sale systems, which are linked up with Headset’s business intelligence software. Headset’s data is very reliable, as it comes digitally direct from our partner retailers. However, the potential does exist for misreporting in the instance of duplicates, incorrectly classified products, inaccurate entry of products into point-of-sale systems, or even simple human error at the point of purchase. Thus, there is a slight margin of error to consider. Brands listed on this page are ranked in the top twenty within the market and product category by total retail sales volume.

