Market Insights Snapshot
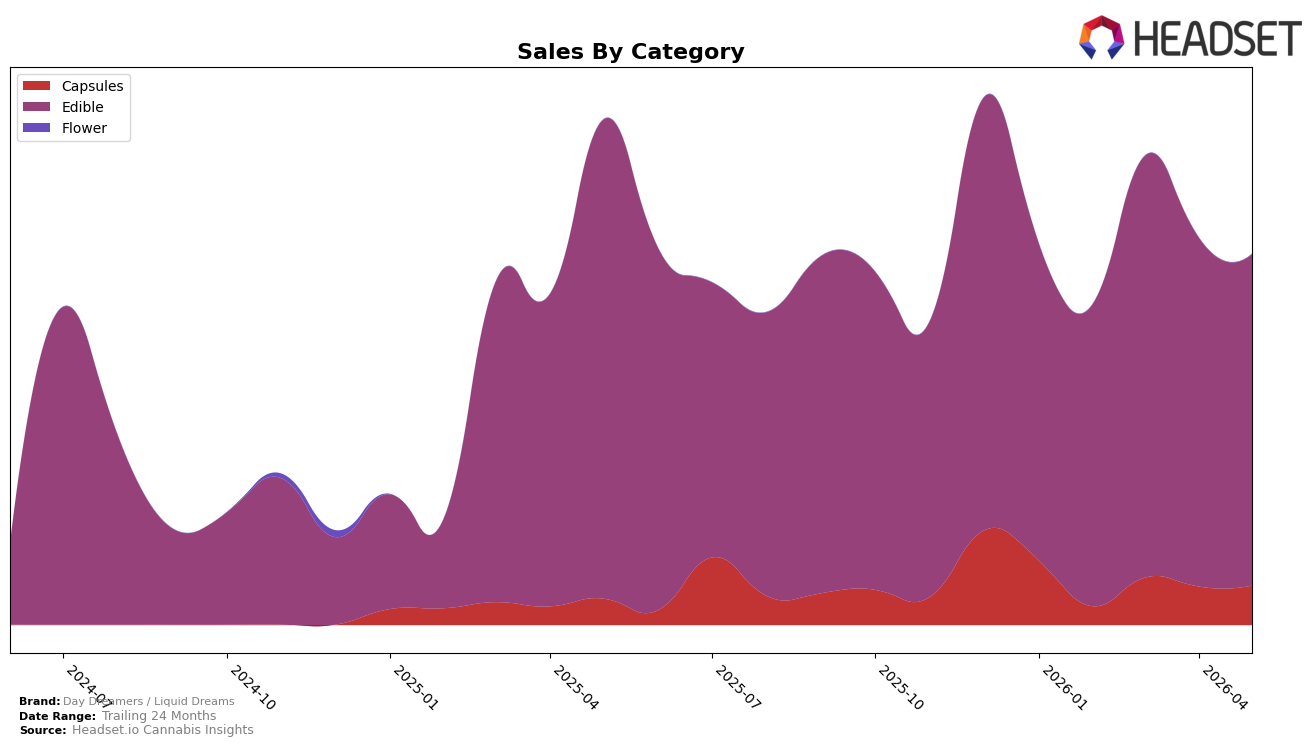
In May 2026, Day Dreamers / Liquid Dreams concentrated 89.40% of sales in Edible, down 5.07% month over month and down 30.86% year over year, while Capsules rose to 10.60% share with a 2.63% MoM gain and a 50.54% YoY increase. Despite a 13.25% YoY drop in average price to $14.25 and a total brand sales decline of 26.65% YoY, the 24‑month sales change stands at 121.19%, indicating the portfolio has expanded over a two‑year window even as Edible contracts. This mix rotation implies an ongoing rebalancing away from Edible toward Capsules, with category elasticity and pricing pressure disproportionately hitting Edible while Capsules capture incremental share.
The tilt toward Capsules (+50.54% YoY growth and +2.63% MoM) alongside Edible contraction (−30.86% YoY and −5.07% MoM) suggests the brand’s positioning is shifting toward functional or format-specific use cases where higher average price points ($19.75 in Capsules vs. $13.79 in Edible) sustain value even amid overall price compression (−13.25% YoY in average price). With May 2026 share concentrated in Edible at 89.40% but the growth engine in the 10.60% Capsules niche, the strategy implied is to leverage Capsules as a margin and growth buffer while selectively pruning or repricing Edible to mitigate the 26.65% YoY sales decline; the pattern points to a pivot toward differentiated, smaller-volume formats to stabilize mix as broader Edible demand softens.
Competitive Landscape
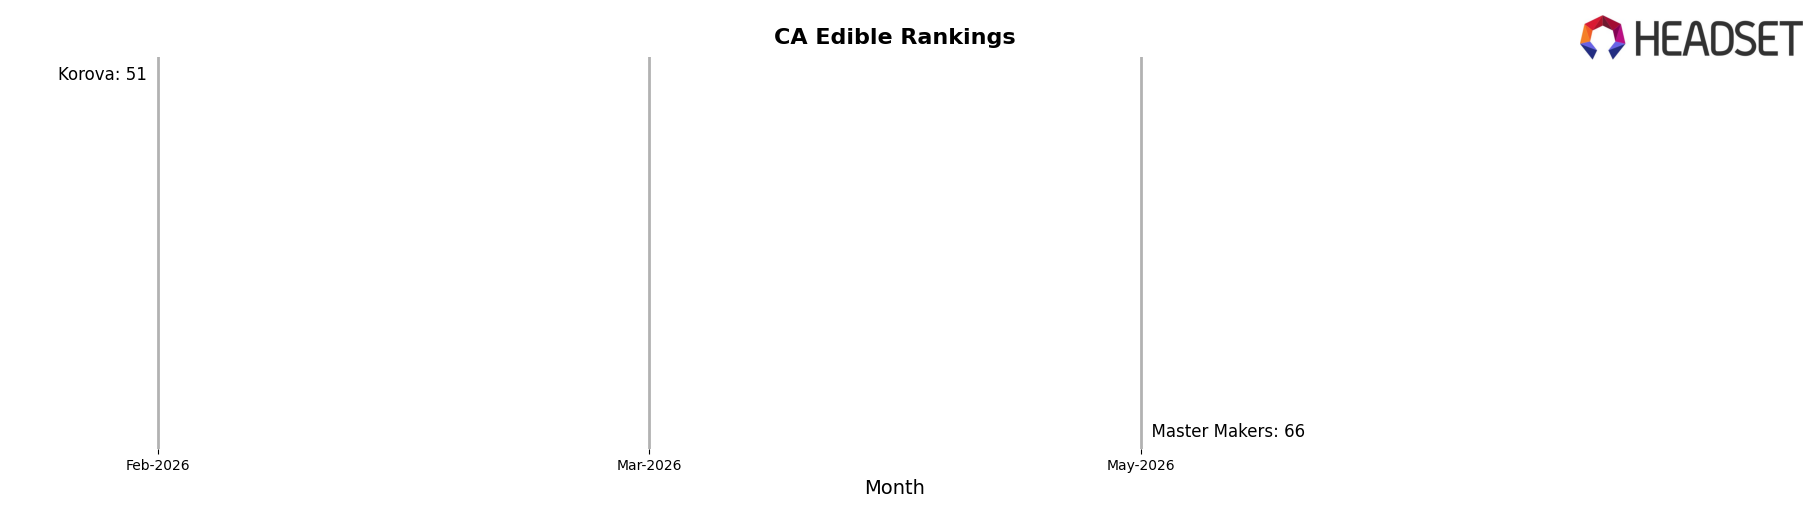
Day Dreamers / Liquid Dreams ranks #68 in CA Edible for May 2026, improving 5 positions from #73 year over year and edging up 4 spots from #72 in February 2026, while sitting 4 places below its March 2026 peak at #64; in contrast, Wyld holds #1 with a -12.9% YoY sales change and Good Tide moved from #6 to #5 with a 14.4% YoY sales increase, indicating Day Dreamers / Liquid Dreams is gaining rank in a market where the leader is contracting and a mid-pack rival is advancing, which implies a pathway for incremental share capture if the brand sustains its post-March trajectory rather than reverting toward its #73 YoY baseline.
Notable Products
Just the Tip - Milk Chocolate Waffle Cones (100mg) posted a 306.4% month-over-month surge in May 2026 to rank 6, while Sativa Chocolate Bar (100mg) fell 50.7% and slid to rank 5. The category mix is concentrated in Edibles, with four of the top six SKUs in May 2026, yet Indica Capsules 10-Pack (250mg) rose 39.9% to rank 4 as Liquid Dreams - Indica Capsules 10-Pack (100mg) declined 27.6% to rank 7. Sativa Semi-Sweet Chocolate Bar 10-Pack (100mg) held rank 1 despite a 7.4% drop, and Indica Chocolate Bar 10-Pack (100mg) contracted 29.3% at rank 3, indicating classic bars ceded momentum to novelty formats and targeted function SKUs. The pattern implies Day Dreamers / Liquid Dreams is pivoting toward differentiated Edible formats and selective capsule use-cases to offset standard bar softness and defend share in June 2026.
Top Selling Cannabis Brands
Data for this report comes from real-time sales reporting by participating cannabis retailers via their point-of-sale systems, which are linked up with Headset’s business intelligence software. Headset’s data is very reliable, as it comes digitally direct from our partner retailers. However, the potential does exist for misreporting in the instance of duplicates, incorrectly classified products, inaccurate entry of products into point-of-sale systems, or even simple human error at the point of purchase. Thus, there is a slight margin of error to consider. Brands listed on this page are ranked in the top twenty within the market and product category by total retail sales volume.

