Jun-2026
Sales
Trend
6-Month
Product Count
SKUs
Avg Price
YoY Sales Change
YoY Price Change
Market Insights Snapshot
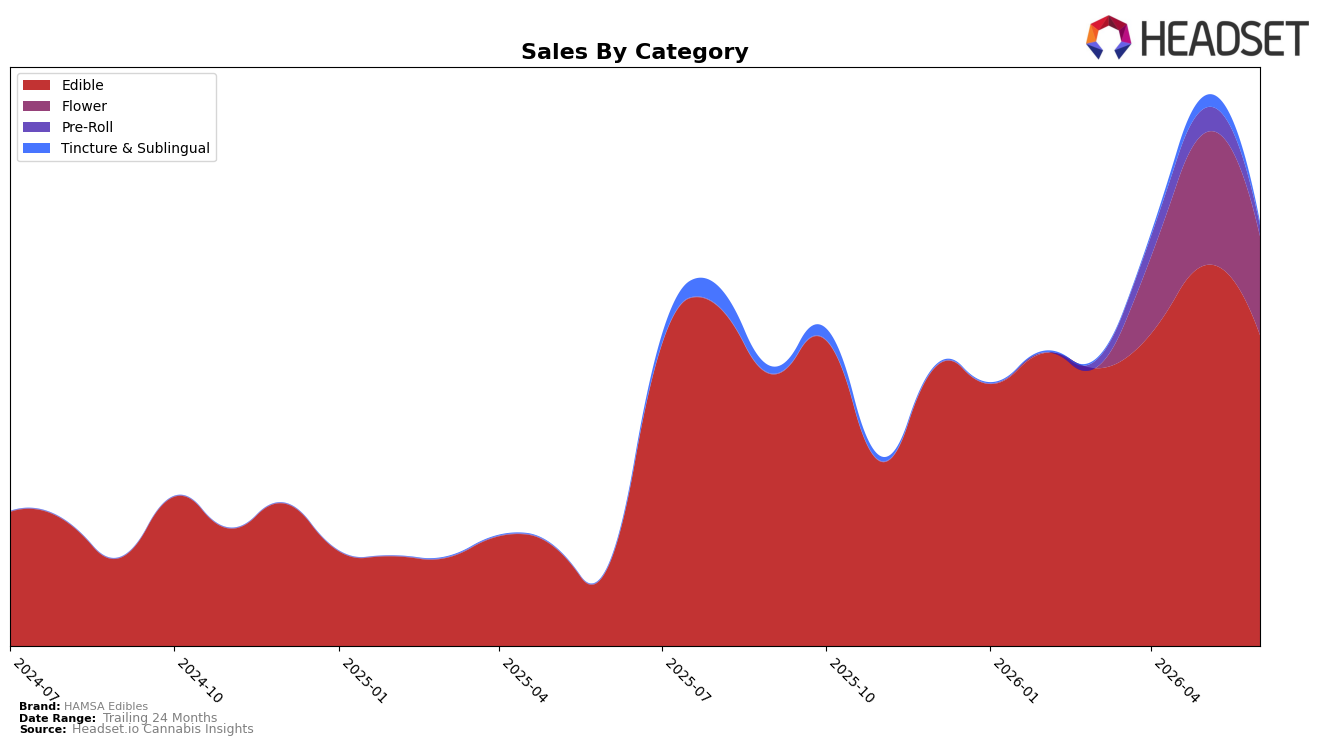
HAMSA Edibles concentrated 73.47% of June 2026 sales in Edible, with Flower at 23.30%, Pre-Roll at 2.49%, and Tincture & Sublingual at 0.74%, indicating a narrowed mix toward one core category. Edible posted 292.08% year-over-year growth while dropping 18.34% month-over-month, whereas Flower fell 25.23% MoM and Pre-Roll declined 57.16% MoM; Tincture & Sublingual grew 226.73% YoY but slid 73.96% MoM. Average prices diverged, with Edible at $16.43 versus Flower at $36.20, suggesting price-driven unit elasticity differences alongside a brand-level average price increase of 59.73% YoY. The pattern implies HAMSA Edibles is scaling Edible demand YoY while absorbing broad-based MoM pullbacks across formats, consolidating revenue dependency in a single category that may amplify near-term volatility.
With Edible share at 73.47% and a June rank of 45 in Edible in New Jersey, the mix and ranking together suggest a scale-first strategy locally that prioritizes depth over breadth. The MoM declines of 18.34% in Edible and 25.23% in Flower, combined with a 57.16% MoM drop in Pre-Roll, point to reduced cross-category reinforcement precisely when the average price rose 59.73% YoY, implying more price tolerance in Edible than in inhalables. Given 427.27% brand-level YoY sales growth alongside a 226.73% YoY rise in Tincture & Sublingual from a 0.74% share base, the implication is that HAMSA Edibles’ positioning leans into Edible-led scale while secondary formats remain too small to buffer monthly swings or materially influence rank momentum.
Competitive Landscape
HAMSA Edibles is currently ranked #45 in New Jersey Edible, improving 12 positions from #57 year over year and up 9 spots from #54 since March 2026; despite that climb, it remains below its peak of #36 from July 2025, indicating a recovery that has not yet matched last summer’s ceiling. Among leaders, Gron / Grön held #1 but with a -22.1% year-over-year sales change, while Wyld advanced from #4 to #2 on +28.1% growth, signaling that headroom exists for rising brands to displace incumbents. The mix of a double-digit rank gain and a gap to a prior peak implies HAMSA Edibles is regaining distribution or velocity faster than a year ago but must convert that momentum into sustained share capture to break back into the mid-30s.

Notable Products
THC:CBN 2:1 Elderberry Sleep Gummies (100mg THC, 50mg CBN) posted the steepest decline in June 2026 at -54.5% and slid to rank 8, while Watermelon Blast Infused Pre-Roll (0.5g) fell -57.2% to rank 10, signaling a retreat in sleep and infused formats. Watermelon Gummies 10-Pack (100mg) held rank 1 despite a -2.6% dip, and Mango Gummies 10-Pack (100mg) at rank 2 contracted -43.2%, indicating demand consolidation at the top. With four of the top ten being Gummies SKUs and Indica Nano Blueberry Gummies 10-Pack (100mg) down -25.0% at rank 3, the edible mix is skewing toward core fruit flavors rather than function-led or nano variants. The pattern suggests HAMSA Edibles is leaning into a tighter, flavor-first gummies core while deprioritizing sleep-positioned and infused offerings in the near term.
Top Selling Cannabis Brands
Data for this report comes from real-time sales reporting by participating cannabis retailers via their point-of-sale systems, which are linked up with Headset’s business intelligence software. Headset’s data is very reliable, as it comes digitally direct from our partner retailers. However, the potential does exist for misreporting in the instance of duplicates, incorrectly classified products, inaccurate entry of products into point-of-sale systems, or even simple human error at the point of purchase. Thus, there is a slight margin of error to consider. Brands listed on this page are ranked in the top twenty within the market and product category by total retail sales volume.

