Jun-2026
Sales
Trend
6-Month
Product Count
SKUs
Avg Price
YoY Sales Change
YoY Price Change
Market Insights Snapshot
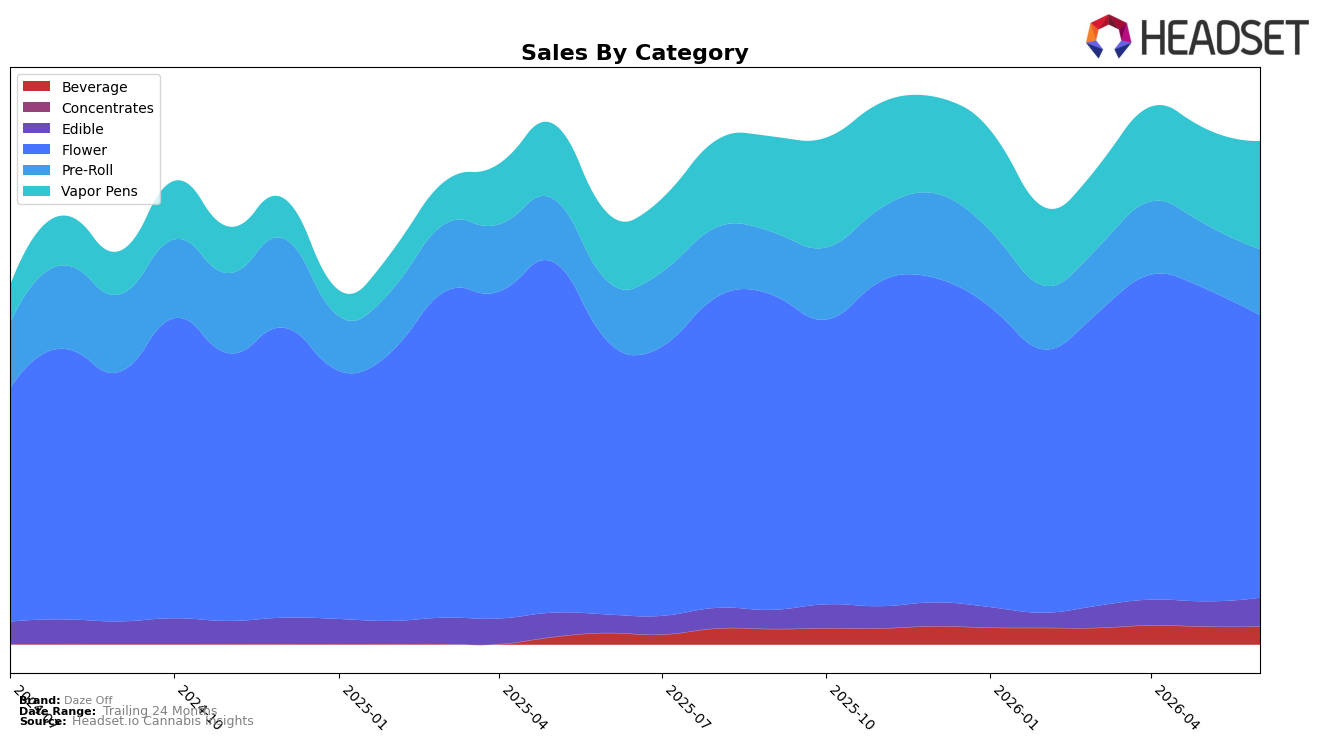
In June 2026, Daze Off concentrated 56.27% of sales in Flower, ranked 7th in Illinois Flower, while Vapor Pens rose to 21.50% share with 59.24% YoY growth and 13.25% MoM growth; by contrast, Flower grew only 3.66% YoY and declined 9.71% MoM. Pre-Roll held 13.06% share with 9.83% YoY and 2.14% MoM increases, and smaller formats accelerated as Edible posted 56.92% YoY and 14.38% MoM growth and Beverage delivered 58.23% YoY with flat 0.20% MoM. The pattern implies category diversification away from a Flower-heavy mix toward higher-velocity non-Flower formats in June 2026, even as the Flower base anchors scale at rank 7.
With brand-level sales up 16.96% YoY alongside a 19.91% YoY drop in average price, the mix shift toward Vapor Pens (21.50% share, +59.24% YoY) and Edible/Beverage (combined 9.17% share, both ~58% YoY) indicates unit-led expansion and price elasticity favoring lower-ticket, faster-turn items; concurrently, the 9.71% MoM decline in Flower vs. double-digit MoM gains in Vapor Pens (+13.25%) and Edible (+14.38%) suggests near-term momentum is concentrated outside Flower. This implies Daze Off’s positioning is migrating from a Flower-dominant identity toward a multi-format portfolio that trades price for volume, using growth in Vapor Pens and ingestibles to buffer Flower variability while maintaining Flower credibility at rank 7 in Illinois.
Competitive Landscape
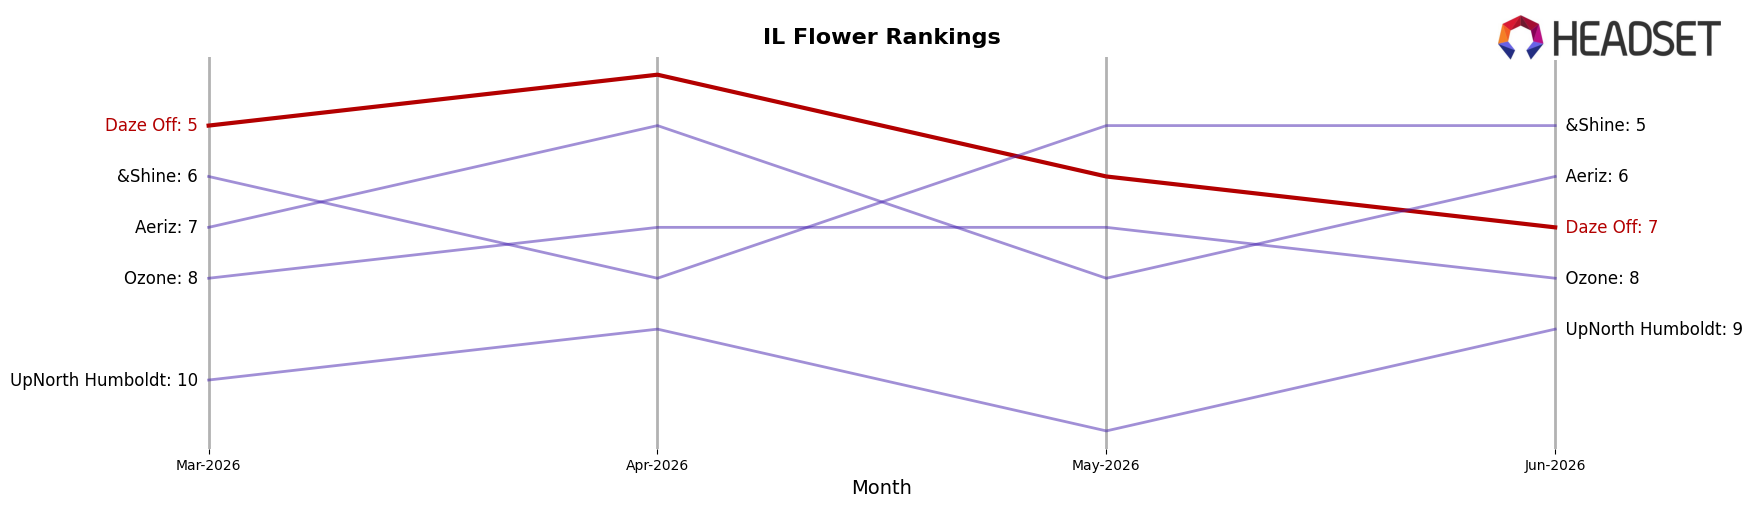
Daze Off sits at rank #7 in Illinois Flower with a year-over-year slip of 1 position from #6, and a 2-rank drop from #5 three months ago to #7 in June 2026; this contrasts with its prior peak at #3 in January 2026, marking a 4-position retreat from peak alongside a 2-position sequential decline since March 2026. Competitors moved in the opposite direction or held ground: High Supply / Supply held #1 year over year and currently, while Good Green climbed from #4 YoY to #3 with a 30.9% sales increase, and &Shine jumped from #10 YoY to #5 with a 28.5% sales lift; meanwhile, Simply Herb slipped from #3 YoY to #4 with a 16.8% sales decline, indicating share is consolidating above Daze Off rather than opening slots below it. The pattern implies Daze Off’s rank trajectory is drifting downward as upward mobility concentrates among faster-rising peers, making a return from #7 toward the January 2026 peak at #3 less likely without a share-capturing intervention.
Notable Products
Taste Buds - Blue Radberry Hundo Gummy (100mg) slid -9.1% month over month to rank 8 while the category leader Taste Buds - THC/CBN 2:1 Moondrop Grape Gummies 10-Pack (100mg THC, 50mg CBN) climbed 47.2% to rank 1, a split that concentrates momentum at the top even as a core SKU softens. Taste Buds - Blue Radberry Gummies 10-Pack (100mg) in rank 2 rose 4.9% while the Blue Radberry Shot in rank 5 added 3.1%, and four of the top ten are Beverage SKUs spanning ranks 5, 6, 7, and 10, signaling a diversified lift across drinks despite mixed Edible trends. With Pre-Rolls holding ranks 3 and 4 without reported MoM deltas and the highest single-SKU revenue at $206,092 sitting in rank 9 for Vapor Pens, the rank-to-revenue mismatch points to heavier basket sizes or velocity outside the top three ranks. Taken together, the mix implies Daze Off is leaning into dose-led Edibles and scaling Beverage presence while premium inhalables monetize efficiently even without top-rank visibility.
Top Selling Cannabis Brands
Data for this report comes from real-time sales reporting by participating cannabis retailers via their point-of-sale systems, which are linked up with Headset’s business intelligence software. Headset’s data is very reliable, as it comes digitally direct from our partner retailers. However, the potential does exist for misreporting in the instance of duplicates, incorrectly classified products, inaccurate entry of products into point-of-sale systems, or even simple human error at the point of purchase. Thus, there is a slight margin of error to consider. Brands listed on this page are ranked in the top twenty within the market and product category by total retail sales volume.

