May-2026
Sales
Trend
6-Month
Product Count
SKUs
Avg Price
YoY Sales Change
YoY Price Change
Market Insights Snapshot
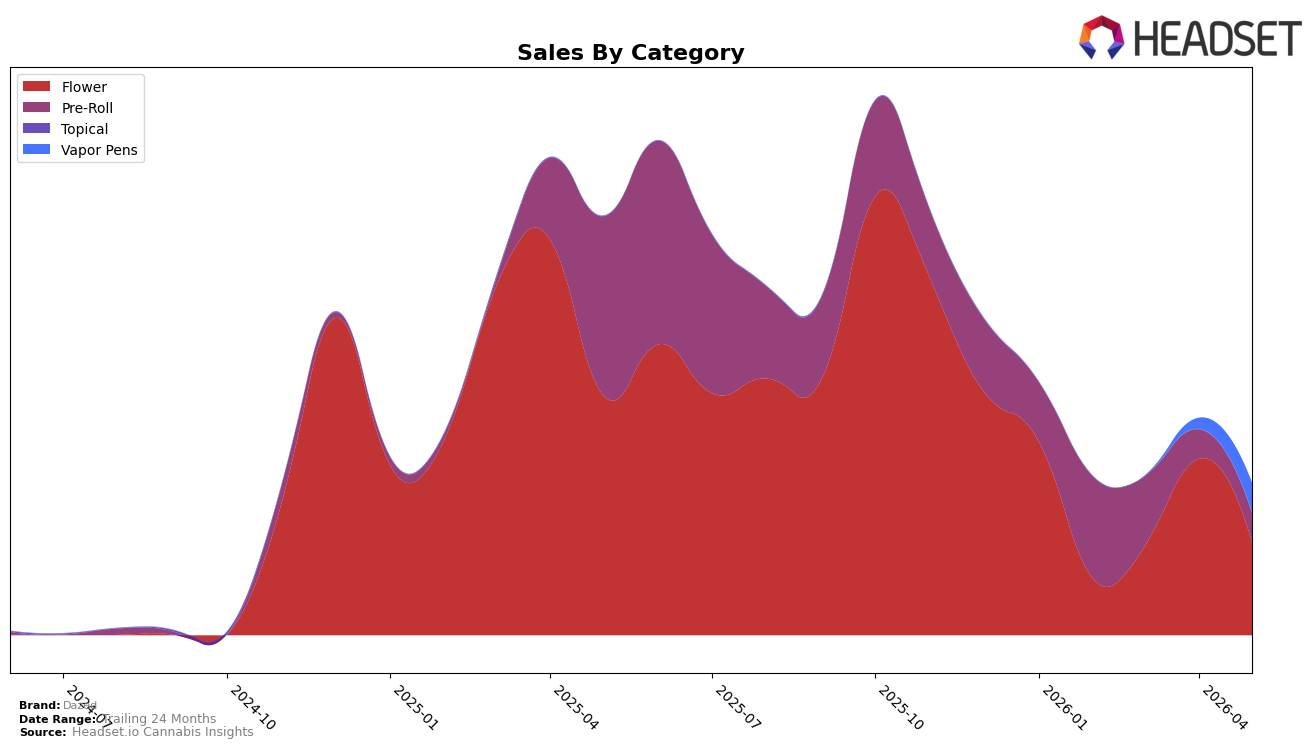
Dazed concentrated 61.03% of May 2026 sales in Flower, but that anchor shrank with a 61.47% year-over-year decline and a 47.60% month-over-month drop, while Pre-Roll at 19.39% share fell 83.61% year over year yet inched up 0.80% month over month. Vapor Pens expanded to 19.23% share on a 168.93% month-over-month increase, and the brand’s average price moved down 14.73% year over year, contrasting with an overall brand sales decline of 63.86% year over year. The mix points to a pivot underway: reliance on Flower is unwinding quickly while Vapor Pens is emerging as the growth vector within the month, implying that category rebalancing rather than pricing alone is the lever to stabilize volume.
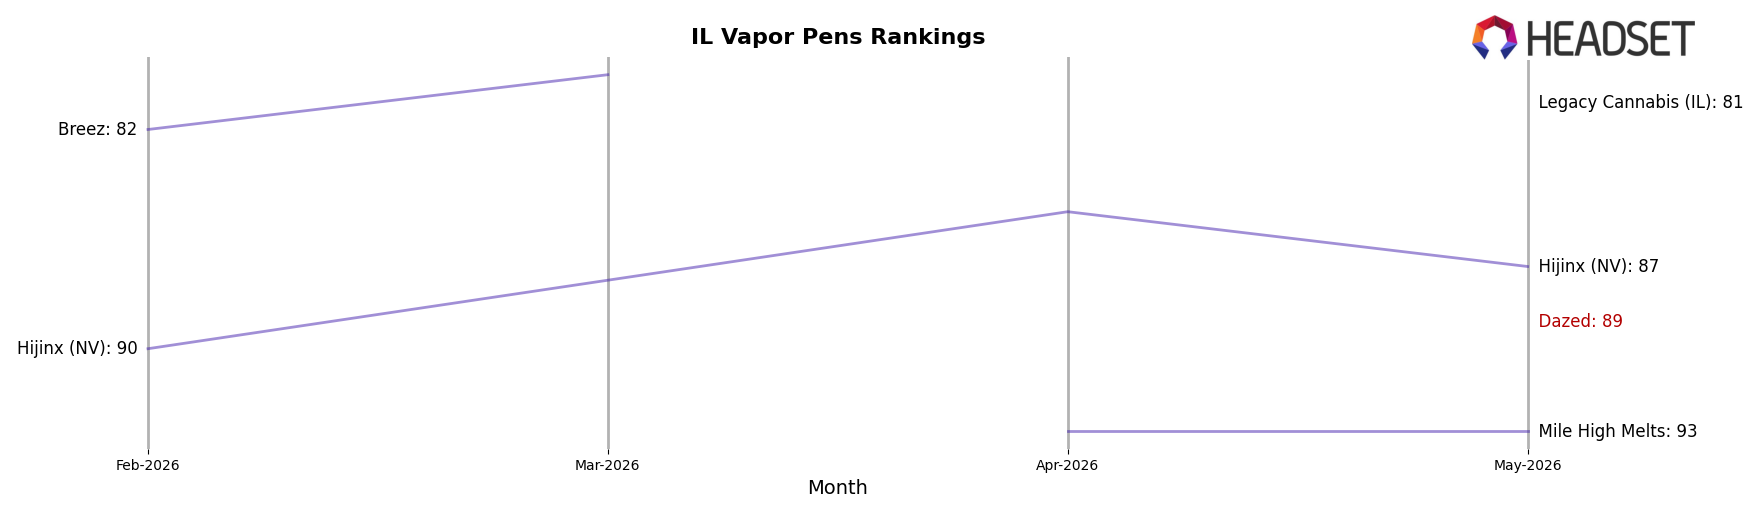
Positioning-wise, the surge in Vapor Pens coincides with a May 2026 rank of 89 in Illinois Vapor Pens, suggesting early traction despite the 63.86% brand-level year-over-year contraction and a 61.47% Flower drag. With Pre-Roll showing 0.80% month-over-month growth off an 83.61% annual decline and Vapor Pens gaining 168.93% month over month to near parity with Pre-Roll share (19.23% vs. 19.39%), the path forward implies prioritizing non-Flower formats to rebuild share where rank momentum can be earned faster than in Flower.
Competitive Landscape
Dazed sits at rank #89 in IL Vapor Pens in May 2026, with no recorded year-over-year rank change available, while its peak rank also sits at #89 in May 2026, indicating a late entry or limited prior presence; by contrast, &Shine holds #1 with a 1-position year-over-year improvement and a 2.50% sales decline, and Select is #2 after climbing from #3 with a 5.42% sales decline, suggesting top-tier incumbents can defend share even amid contraction. Additional pressure is visible as Joos sits at #3 after slipping from #2 with a 39.64% sales drop and RYTHM is #4 after improving from #5 with an 11.47% sales decline, implying that Dazed’s debut at #89 enters a ladder where upward mobility requires displacing brands that are improving rank despite negative year-over-year sales, so the trajectory points to a long climb rather than quick share capture.
Notable Products
Purple Sunset Pre-Roll (1g) led the movement with a -65.7% month-over-month decline and sat at rank 9, while Blueberry Cupcake (3.5g) dropped -55.4% yet held rank 1, indicating share consolidation at the top despite contraction. Five of the top ten are Pre-Roll SKUs, but three of those—Fruit Salad Infused Pre-Roll (1g) at -34.9%, Chubby Chaser Pre-Roll (1g) at -38.8%, and Strawberry Cookies Pre-Roll (1g) at -23.6%—fell alongside Peanut Butter & Jelly Pre-Roll (1g) at -5.6% versus Dream Cream Pre-Roll (1g) gaining +22.8% to rank 2, pointing to fragmentation within the format. Two Flower entries with no prior month—Dirty Sprite Snowballs (3.5g) at rank 8 and Darryl Strawberry Snowballs (3.5g) at rank 10—enter alongside a $2,974 result for Blueberry Cupcake (3.5g), implying a pivot toward novelty Flower to offset Pre-Roll volatility.
Top Selling Cannabis Brands
Data for this report comes from real-time sales reporting by participating cannabis retailers via their point-of-sale systems, which are linked up with Headset’s business intelligence software. Headset’s data is very reliable, as it comes digitally direct from our partner retailers. However, the potential does exist for misreporting in the instance of duplicates, incorrectly classified products, inaccurate entry of products into point-of-sale systems, or even simple human error at the point of purchase. Thus, there is a slight margin of error to consider. Brands listed on this page are ranked in the top twenty within the market and product category by total retail sales volume.

